Back to the on-screen lesson ·
An observation records what customers did, dated and counted; an interpretation explains it and an opinion wants something, and only the first is evidence.
Paper packet. Every task here also exists on screen, where it is checked automatically; answers written on paper are not assessed by Nydus. When you are back at a device, enter your answers there.
You will separate what customers did from what the owner thinks it means, keep a dated tally that answers a question decided in advance, and choose the record that could settle a stated question.
You can describe a segment and the job its customers are trying to get done. Both were built from what people did. This lesson is about recording what they did well enough that it can be trusted, counted again, and used to judge whether a change worked.
| Term | What it means |
|---|---|
| Observation | A record of something that happened, which anyone there could check. |
| Interpretation | An explanation of why it happened. |
| Opinion | What the observer likes, wants or hopes. |
| Tally | A count kept as things happen, with the date and time. |
| Baseline | The count before a change, which the count after is compared with. |
| Rate | A count divided by the number of chances it had to happen. |
Listen to an owner describe a busy lunchtime: 'Loads of people gave up on the line because it's too slow — we need a bigger counter.' That sentence holds three different things. Something happened: people joined the line and left before ordering. An explanation: the line looked slow to them. A preference: the owner wants a bigger counter. Only the first is evidence. The second might be right; it might also be that the menu board is unreadable, or that people had a meeting to get to. The third is a decision that nobody has earned yet.
The fix is a habit. Write down what happened, with a number and a time, before writing down why. '12:10 to 12:40: 9 people joined the line and left before ordering; the line reached the door at 12:25' can be checked, counted again next Tuesday and compared after any change. 'People hate the line' cannot.
Another way: table
One lunchtime, taken apart.
| The owner said | What kind of statement |
|---|---|
| 9 people joined the line and left before ordering | Observation |
| The line reached the door at 12:25 | Observation |
| They left because it looked slow | Interpretation |
| We need a bigger counter | Opinion |
Another way: steps
A tally answers the question it was designed for and very little else. If Dev at Northside Repairs wants to know whether speed or price matters more to his customers, he counts two things for a week: customers who ask to have the item back by tomorrow, and customers who ask for a cheaper part. Counting everything that happens in the shop would bury the answer.
Keep the record dated and boring: day, time, what was done, a mark in a column. And record the behavior the question is about, at the moments it happens: to find out whether walk-ins leave when the wait is long, write down the wait and whether they stayed, for each one. Asking customers whether they mind waiting records an opinion, and people's opinions about their own behavior are often wrong.
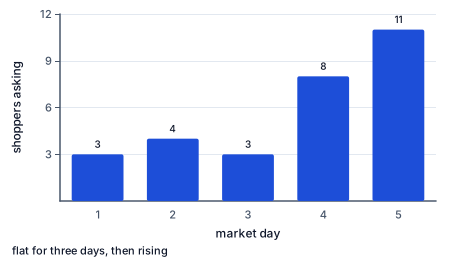
Monica counted how many shoppers asked for a pre-packed weekly vegetable bag on five market days. Written as a list, 3, 4, 3, 8, 11, the pattern is easy to miss; drawn as bars, the flat start and the climb over the last two days are obvious. A plot is the quickest way to see whether something is steady, rising or a one-off spike.
It is also a warning against acting too fast. Two high days could be a holiday weekend or a neighbor's recommendation that will not repeat. Monica keeps counting for three more weeks before deciding whether to make the bags a regular line.
Write the question. 'Do walk-ins leave when the wait is long?' or 'Does the new sign change how many shoppers put the berries back?'
Choose the behavior and the moment. Count what people do at the point the question is about: at the price sign, at the end of the line, on the phone.
Tally it with the date. A mark per event, in a column per behavior, with the day and the hour.
Turn counts into rates. If 14 of 40 put the berries back one Saturday and 8 of 25 the next, the counts mislead; the rates, 35 percent and 32 percent, compare like with like.
Compare with the baseline. The count before a change is the yardstick for the count after.
Check the answer. A rate can never exceed a hundred percent, so if it does, the wrong number is on the bottom. Totals must equal the sum of the days. And a difference between two days is only worth acting on if it repeats.
Counts depend on how many chances there were. Ten people leaving a line on a day with 200 customers is a smaller problem than six leaving on a day with 40. Dividing by the number of chances — shoppers who picked up the punnet, walk-ins who were quoted a wait — is what makes two days comparable. It is allowed because each chance could have gone either way, so the share that went one way measures how likely that was.
People behave differently when they know they are being watched, so the best observation is quiet and routine: a tick on a pad behind the counter, a column in the booking log, a staff member who notes what callers ask about. It should also be honest about who is counted. A tally kept only on busy Saturdays tells you about Saturday customers; if the question is about the whole week, count on quiet days too.
Watching customers is ordinary and useful, but it has limits. Count behavior, not people: a tally of how many shoppers picked up the berries needs no names, faces or phone numbers. Keep the notes about what happened, not about who did it. If a business wants to record identifiable people, such as with a camera that keeps footage, state and local rules about notice and consent apply, and customers should be told plainly.
Most of the evidence a small business needs comes from counts like the ones in this lesson, which identify nobody: marks on a pad, columns in a log, the number of calls asking about Saturday. They are easier to keep, harder to misuse, and enough to answer the questions that matter.
An observation earns a decision only after it has been counted, turned into a rate, and repeated. Monica's first Saturday showed 35 percent of shoppers putting the berries back; the next, with the price per pound on the sign, 20 percent. Two Saturdays are a start, not a finding: the second might have been sunnier, busier or full of regulars who know the price. Three or four weeks of counts before and after a change tell her far more than one pair.
Write down, before the change, what result would make you keep it. If Monica decides in advance that a put-back rate under 25 percent for three Saturdays means the new sign stays, the data decides, not her mood on the day.
A tally needs very little: a sheet of paper on a clipboard with a column for each behavior and a row for each hour, or a column added to the booking spreadsheet. What matters is that it is the same every day, filled in at the moment, and kept somewhere it will not be thrown away.
Make the columns as narrow as the question. 'Walked up and left without ordering' is one column; 'asked about vegetarian options' is another. A column called 'comments' collects interpretations and opinions, which is exactly what the tally is meant to keep out. At the end of each day, total the columns and copy the totals into a weekly sheet, so a month of counts can be read at a glance and plotted.
When staff help with the tally, show them one example of each column before they start, so that two people counting the same lunchtime would arrive at the same numbers.
A tally says how often something happened, not why. When the count of walk-aways doubles, the reasons could be a slower cashier, a new competitor, rain that brought a different crowd, or a menu change. The count tells you where to look; the next lesson's interviews, and small tests later in the course, tell you which reason is true. Treat every count as a well-aimed question rather than an answer.
A coffee cart outside a train station in New Jersey sold about 180 drinks each weekday morning, and the owner was sure he was losing customers to the line. He wanted to hire a second barista for 18 dollars an hour, three hours a morning: 54 dollars a day.
Before hiring, he asked his partner to tally for two weeks, from 6:30 to 9:30, every person who joined the line and left before ordering, and the time. The count averaged 14 walk-aways a morning, and 11 of the 14 came between 7:40 and 8:10, when two trains arrived together. Outside that half-hour the line moved fine.
With a drink contributing about 2.80 dollars, 14 lost sales a morning were worth about 39 dollars, less than the 54 a second barista for three hours would cost. So he hired help for just the 40 minutes around the double train, at 12 dollars a day. Walk-aways fell to an average of 4. The tally turned 'we lose people to the line' into a count, a time and a cheaper fix.
Market researchers and retail designers, such as the firm Envirosell founded by Paco Underhill, built their work on watching shoppers rather than surveying them, because people's accounts of what they did in a store often differ from what video and tally sheets show. The habit in this lesson is the same idea at the scale of a market stall: count what people do at the moment they do it.
A confident explanation is evidence. It is a hypothesis, and the count it came from is the evidence.
One vivid customer is a pattern. The loudest complaint of the week is one observation; the tally says how common it is.
Asking people is observing them. What customers say they do and what they do are often different.
Record everything, and the answer will appear. Decide the question first, then count what bears on it.
Read Monica's belief about her berries.
$\text{too expensive}$
An interpretation, before any evidence.
Write the question.
$\text{do shoppers put them back after reading the price?}$
A behavior at a moment.
Tally one Saturday.
$14 \text{ put back of } 40 \text{ picked up}$
Counted as it happened.
Turn the count into a rate.
$14 \div 40 \times 100 = 35$
The baseline.
Add the price per pound to the sign and tally again.
$8 \div 40 \times 100 = 20$
Fifteen points lower after the change.
Write the question.
$\text{do customers ask more about speed or price?}$
Decided before counting.
Tally the speed requests for the week.
$9 + 6 + 12 + 8 + 10 = 45$
Monday to Friday.
Find the average day.
$45 \div 5 = 9$
Nine a day.
Tally the price requests.
$2 \times 5 = 10$
Two every day.
Compare the rows.
$45 \text{ against } 10$
Speed is asked about four and a half times as often.
Say what the count does not say.
$\text{why they ask}$
That is a question for interviews, the next lesson.
Separate the owner's sentence into its parts.
$\text{left the line; looked slow; bigger counter}$
Observation, interpretation, opinion.
Write the question for the observation.
$\text{how many leave, and when?}$
Only the first part is evidence.
Tally five lunchtimes.
$9, \ 4, \ 11, \ 6, \ 10$
People who joined and left.
Find the average lunchtime.
$40 \div 5 = 8$
The baseline.
Note the time each line peaked.
$\text{12:20 to 12:35 every day}$
A pattern, not a single bad day.
Try a cheap change first.
$\text{a second till for fifteen minutes}$
Before the bigger counter.
Tally again and compare.
$8 \to 3 \text{ a day}$
The change coincided with five fewer walk-aways a day.
Find the observation in 'people ring and don't book because we're too dear'.
$\text{people ring and do not book}$
The rest is an interpretation.
Choose what to tally for two weeks.
$\text{date, what was asked, price given, booked or not}$
Each call, as it happens.
Say how to use the tally.
Neighborhood Kitchen's owner wrote these notes after a busy Tuesday. Sort each one.
| Observation | Interpretation | Opinion | |
|---|---|---|---|
| $12$ people joined the line and left before ordering | |||
| They left because the line looked slow | |||
| The line reached the door at $13$ minutes past twelve | |||
| We need a bigger counter |
Complete the worked solution: on one Saturday, $50$ shoppers picked up a punnet of berries and $16$ put it back after reading the price. On the next, with the price per pound added to the sign, $50$ picked one up and $5$ put it back. Find each Saturday's put-back rate and how far it fell.
Find the first Saturday's rate.
$(\text{put back}) \div 50 \times \text{a hundred} =$ f
A share of those who picked one up.
Find the second Saturday's rate.
$(\text{put back}) \div 50 \times \text{a hundred} =$ s
The same count after the change.
Find the fall in percentage points.
$(\text{first rate}) - (\text{second rate}) =$ d
The change the new sign coincided with.
Say what one pair of Saturdays can show.
$\text{a change worth checking again}$
Weather or crowds may differ; repeat before deciding.
Maya watched her stall at the craft fair for an hour. Mark every note that records something that happened.
This task has no paper form; do it on a device.
Northside Repairs tallied two behaviors for a week. Customers who asked 'can I have it back by tomorrow?' were counted as $9$, $8$, $12$, $5$ and $6$ on Monday to Friday; customers who asked for a cheaper part came in at $3$ every day. Fill in each row's total for the week and the average day.
| Week's total | Average day | |
|---|---|---|
| Asked for it back tomorrow | ||
| Asked for a cheaper part |
Monica counted how many shoppers asked for a pre-packed weekly vegetable bag on each of five market days: $4$, $5$, $7$, $11$ and $13$, in that order. Plot the count for each day.
Plot your answer on the grid:
A Chicago food truck counted the people who walked up, read the menu board and left without ordering: $4$, $8$, $3$, $12$ and $8$ over five lunchtimes. How many walked away on an average lunchtime?
Answer:
A hairdresser wonders whether walk-in customers leave when the wait is over $20$ minutes. Which record, kept for two weeks, could answer that?
Lesson test: one question per skill, one attempt each, no hints. Your answers are checked when you submit.
One Saturday, Monica counted $40$ shoppers who picked up a punnet of berries. $29$ of them read the price sign and put it back. What percentage of those who picked one up put it back after reading the price?
Of those who picked up a punnet, v percent put it back after reading the price.
You can pull the observation out of a sentence that mixes it with an explanation and a wish, and count it properly. Tell someone why 'people hate the line' is not evidence. Next: asking customers questions that produce evidence instead of compliments.
20. Your turn: Bright Home Cleaning's phone calls, step 3
$\text{booking rate with and without a price given}$
Rates compare like with like.