Back to the on-screen lesson ·
Retention is the share of a fixed starting group that bought again within a stated window; newcomers stay out of it, and the share who did not return is the question to investigate.
Paper packet. Every task here also exists on screen, where it is checked automatically; answers written on paper are not assessed by Nydus. When you are back at a device, enter your answers there.
You will compute retention for a defined starting group over a stated window, keep newcomers out of it, plot a group fading over months, and work out the share who did not return.
Acquisition cost showed that many customers only pay for the channel that brought them if they buy again. This unit measures whether they do, starting with the most basic figure: retention.
| Term | What it means |
|---|---|
| Starting group | Customers fixed by one thing, such as when they first bought; also a cohort. |
| Window | The stated period the group is followed over. |
| Retention | The share of the group that bought again within the window. |
| Churn | The share of the group that did not buy again. |
| Newcomer | Anyone who first bought after the group was fixed. |
| Retention curve | The share of a group still buying, month by month. |
$$\text{retention} = \frac{\text{members of the group who bought again}}{\text{everyone in the group}} \times 100$$
Bright Home Cleaning had 40 households whose first clean was in March. By the end of June, 26 of them had booked again. Retention over that window is 26 ÷ 40 × 100 = 65 percent, and the other 35 percent did not come back.
The trap is in the denominator. In the same months, 15 new households booked for the first time. They are not in the March group, so they belong in neither the top nor the bottom of the fraction. Add them to the top and retention looks better than it is: (26 + 15) ÷ 40 is over 100 percent, which is how owners discover they have measured growth, not retention. Add them to the bottom and it looks worse. Keep them out; they will be the next group.
The window must be stated too. 'Retention is 65 percent' means nothing without 'of March's first-time households, by the end of June'. A different window gives a different figure, and both can be true.
Another way: table
Bright Home Cleaning's March group.
| Households | |
|---|---|
| In the March group | 40 |
| Booked again by end of June | 26 |
| Retention | 65 percent |
| New in April to June (not in the group) | 15 |
Another way: steps
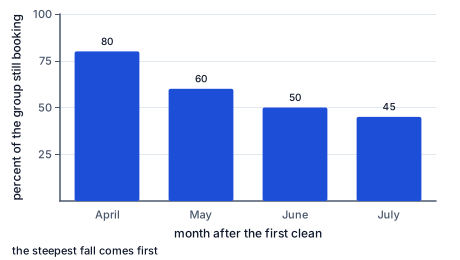
Measure the same group month by month and a shape appears. Of the March households, 80 percent booked in April, 60 percent were still booking in May, 50 in June and 45 in July.
The curve drops fastest at the start and flattens: customers who stay through the first few months mostly stay. That tells the owner where effort pays most: the first and second cleans, the first follow-up, the first problem put right.
The share who did not return is not a verdict; it is a question. The alternatives lesson applies: did they go to a competitor, do it themselves, or decide they no longer needed the job done? A phone call to a handful of them, using the interview habits from lesson 5, usually answers it better than any survey. And compare like with like: retention of the move-out segment will be low by design, because they have moved out, while weekly households should stay. Measure each segment's group separately.
Fix the group. One defining fact, decided before counting: first clean in March, first order in the first week of May, a loyalty card used in January. Write down the number in the group.
State the window. By the end of June; within six months; in the next month. The window should suit how often customers normally buy: a week for lunches, a season for bike services.
Count the returners. Members of the group who bought again inside the window, each counted once, however many times they bought.
Divide. Returners over the group, times a hundred.
Find the share who did not return. A hundred less the retention rate.
Leave newcomers out. List them separately; they are the next group.
Check the answer. The retention rate can never be above a hundred percent; if it is, newcomers have crept into the top. Returners plus those who did not return must equal the group. And the sentence that reports the figure must name the group and the window.
Fixing the group first is needed because retention asks about particular people: did these customers come back? Any change to the group after counting starts changes the question.
Counting customers, not purchases, is allowed because retention is about who stayed. One office ordering four times is one retained customer; counting its orders would make one loyal customer look like four.
Leaving newcomers out is needed because they answer a different question, how many arrived. Adding them to the top can push retention over a hundred percent; adding them to the bottom drags it down for people who were never given the chance to return.
Taking the rate from a hundred is allowed because every member of the group either returned within the window or did not; the two shares make up the whole group.
The right window depends on how often the customer would normally buy. Neighborhood Kitchen's offices order weekly, so a month tells the owner a lot. Northside Repairs' customers need a service once or twice a year, so a month would make retention look terrible when nothing is wrong. Maya's mug buyers might buy again only for a gift, so six months or a year is fairer.
Pick the window once, write it down, and use the same one every time, so that this spring's group can be compared with last spring's. If the business wants to know about both the short and the long term, report two figures, each with its window named: 'of March's households, 80 percent booked again by the end of April and 45 percent were still booking in July'.
Retention connects the course's figures. Acquisition cost told the owner what it cost to win a customer, and payback told them how many purchases it takes to earn that back. Retention says how many customers actually make those purchases.
If Bright Home Cleaning pays 80 dollars to win a household and a clean contributes 40, the household pays back after two cleans. With 80 percent booking a second clean, most do. If retention fell to 30 percent, most households would never pay back their cost, and the channel that looked cheap would be losing money. The next lessons build on this: referrals from retained customers, and the value of a customer over the whole time they stay.
Retention can only be measured if the business can tell one customer from another over time. A booking log with names, a loyalty card, a customer list in a spreadsheet, or order emails are all enough. What matters is that each customer has one entry that stays the same, so the second purchase can be matched to the first.
Add a column for the date of the first purchase. With it, any group can be fixed later by sorting: every customer whose first purchase was in March. Without it, the owner has to guess who is new, and newcomers slip into the count.
Cash businesses without names, such as a market stall, can still measure retention with a simple card stamped at each visit, as Monica does. The card number is the customer's identity, and the first stamp date fixes the group.
Retention is improved where the curve falls fastest: the first weeks. The first visit after the first purchase is the one most customers fail to make, and it is the easiest to help. A follow-up agreed at the first job, a reminder timed to the next real need, a first problem put right quickly: each lifts the second-month figure, and the rest of the curve lifts with it.
Measure before and after any change, with the same group definition and the same window, so the effect can be seen. A change that lifts the first month's retention from 60 to 70 percent is worth more than almost any new channel, because every customer already won stays longer and buys more.
A small coffee roaster in Nashville sells bags by subscription. For its first two years it reported 'retention' as the number of active subscribers this month over the number last month, and the figure always looked healthy, often above 95 percent, because new subscribers kept replacing the ones who left.
An adviser suggested following each month's new subscribers as a group. Of the 150 who signed up in January, 105 were still subscribed after one month, 75 after three, and 60 after six: 70, 50 and 40 percent. The overall count had hidden that more than half of each new group left within three months.
The owners called a dozen of the January subscribers who had canceled. Most said the same thing: two bags a month was too much coffee, and there was no way to pause. The roaster added a one-bag option and a pause button. The next spring's group kept 65 percent after three months instead of 50, and the overall subscriber count, for the first time, grew mostly because people stayed.
Following a group fixed by when customers started is called cohort analysis, and it is standard in subscription businesses, banks and public health. The idea is the same at every scale: keep the group fixed, state the window, and never let newcomers into the count.
Retention is all customers acquired this year. That counts arrivals, not returns.
Count new customers as retained. They were never in the group.
Count orders instead of customers. One loyal office ordering twice as often does not mean twice as many stayed.
One retention figure fits the whole business. Segments with different jobs retain differently; measure each.
Any window will do. The window must suit how often customers normally buy, and be stated.
Fix the group.
$200 \text{ cards used in January}$
One defining fact.
State the window.
$\text{used again in February}$
Weekly shoppers, so a month suits.
Count the returners.
$142$
Each card counted once.
Work out retention.
$142 \div 200 \times 100 = 71$
Returned over the group.
Leave the newcomers out.
$60 \text{ new cards: next group}$
In neither figure.
Fix the group.
$40 \text{ first cleans in March}$
Decided before counting.
State the window.
$\text{by the end of June}$
Named with the figure.
Count the returners.
$26$
Booked again in the window.
Work out retention.
$26 \div 40 \times 100 = 65$
Returned over the group.
Work out the share who left.
$100 - 65 = 35$
The rest of the group.
Check the newcomers stayed out.
$(26 + 15) \div 40 > 1$
Adding them would pass a hundred percent.
Fix the office group.
$120 \text{ offices, first week of May}$
One segment.
Count the office returners.
$66 \text{ in the first week of June}$
A one-month window.
Work out office retention.
$66 \div 120 \times 100 = 55$
Returned over the group.
Fix the walk-in group.
$80 \text{ first-time walk-ins in May}$
A second segment.
Count the walk-in returners.
$20 \text{ in June}$
The same window.
Work out walk-in retention.
$20 \div 80 \times 100 = 25$
Far lower.
Decide what to investigate.
$\text{why walk-ins do not return}$
Each segment measured separately.
Fix the group: 50 serviced last spring, 22 new customers this spring.
$50$
The new customers are not in it.
Work out retention: 19 came back.
$19 \div 50 \times 100 = 38$
Returned over the group.
Work out the share who did not return.
Neighborhood Kitchen wants to know how well it keeps its office customers. Which calculation measures retention?
Complete the worked solution: $25$ offices ordered from Neighborhood Kitchen for the first time in April. By the end of June, $19$ of them had ordered again, and $10$ new offices had ordered for the first time. Find the retention rate, the offices in the group that did not return, and the share that did not return.
Find the retention rate.
$(\text{returned}) \div (\text{group}) \times \text{a hundred} =$ p
The new offices are not in the group.
Find the offices that did not return.
$(\text{group}) - (\text{returned}) =$ n
Members of the group who did not order again.
Find the share that did not return.
$\text{a hundred} - (\text{retention}) =$ c
The two shares make up the whole group.
Say what to do with the share that left.
$\text{call a few and ask what they did instead}$
It is a question, not a verdict.
Bright Home Cleaning is measuring retention for households who had their first clean in March. Mark every customer who belongs in that starting group.
This task has no paper form; do it on a device.
At Neighborhood Kitchen, $120$ offices that ordered lunch in the first week of May. Of them, $66$ ordered again in the first week of June. In the same months $30$ new customers bought for the first time. Fill in the retention rate and the share of the group who did not return, as percentages.
| Percent of the group | |
|---|---|
| Retention | |
| Did not return |
Bright Home Cleaning followed the households who had a first clean in March. Of the group, $70$ percent booked again in April, $60$ percent were still booking in May, $45$ percent in June and $40$ percent in July. Plot the percentage still booking in each month, with April as month $1$.
Plot your answer on the grid:
A yoga studio in Salt Lake City signed up $60$ members in January. By the end of April, $45$ of those January members were still paying. Between February and April, $27$ new members joined. What is the retention rate of the January group, as a percentage?
Answer:
At Northside Repairs, $50$ customers whose bikes were serviced last spring. Of them, $19$ came back for a service this spring. In the same months $22$ new customers bought for the first time. What is the retention rate, as a percentage?
Answer:
Lesson test: one question per skill, one attempt each, no hints. Your answers are checked when you submit.
Northside Repairs followed the $40$ customers whose bikes were serviced last spring. $36$ came back for a service this spring. What percentage of the group did not come back?
Answer:
You can measure whether customers come back without mixing in the ones who have just arrived. Tell someone how retention above one hundred percent can happen, and why it is wrong. Next: asking for referrals.
18. Your turn: Northside Repairs' spring services, step 3
$100 - 38 = 62$
The question to investigate.