Back to the on-screen lesson ·
A funnel counts people at defined, consecutive steps; the onward rate at each step shows where it leaks worst, which is often not where the most people are lost.
Paper packet. Every task here also exists on screen, where it is checked automatically; answers written on paper are not assessed by Nydus. When you are back at a device, enter your answers there.
You will compute the onward rate at each step of a funnel, find the step that leaks worst, tell it apart from the step that loses the most people, and compute the end-to-end rate.
You can trace which channel brought a customer and compare response rates. A funnel follows the same people further: from first noticing the business, through each step, to paying, and shows where they stop.
| Term | What it means |
|---|---|
| Funnel | The count of people at each of a few defined, consecutive steps toward a purchase. |
| Step | A point that can be counted from records, such as a quote sent. |
| Onward rate | The share at a step who went on to the next, as a percentage. |
| End-to-end rate | The share of those at the first step who reached the last. |
| Leak | Where people drop out between one step and the next. |
| People lost | The count at a step less the count at the next. |
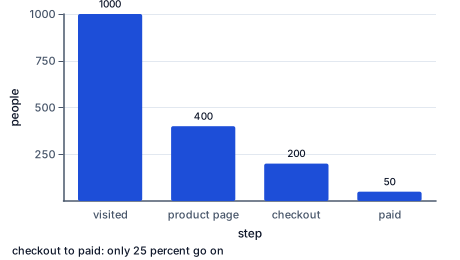
Maya's online shop last month: 1,000 people visited, 400 opened a product page, 200 started to check out, and 50 paid. The biggest number of people lost is at the first step, 600 visitors who never opened a product, and that is where an owner's eye goes. It is the wrong place to look first.
Work out the onward rate at each step instead:
$$\text{onward rate} = \frac{\text{count at the next step}}{\text{count at this step}} \times 100$$
Visit to product page: 400 ÷ 1,000 = 40 percent. Product page to checkout: 200 ÷ 400 = 50 percent. Checkout to paid: 50 ÷ 200 = 25 percent. The worst leak is at the very end: three in four people who had started to pay gave up. Losing visitors at the first step is normal for any shop; losing three quarters of the people who had decided to buy points to something specific at checkout, such as a surprise shipping charge, a form that fails on a phone, or a missing payment method.
Another way: table
Maya's online shop, one month.
| Step | People | Onward rate | People lost |
|---|---|---|---|
| Visited | 1,000 | 40% | 600 |
| Opened a product page | 400 | 50% | 200 |
| Started to check out | 200 | 25% | 150 |
| Paid | 50 |
Another way: steps
A funnel is only as good as its steps. Each must be defined so that it can be counted from the records, such as a quote requested, a visit made, a written quote sent or a booking paid, and the steps must follow each other, so that everyone at step three passed through step two. A funnel for Bright Home Cleaning built from the booking book is honest; one that mixes 'people who liked the post' with 'people who booked' is not a funnel.
The end-to-end rate, last step over first, summarizes the whole thing: 50 of 1,000 is 5 percent. It is also the three onward rates multiplied together (0.4 × 0.5 × 0.25 = 0.05), which is why fixing the worst step does so much: raising checkout from 25 to 50 percent doubles the end-to-end rate without one more visitor. Before buying more traffic for the top of a funnel, fix the step that leaks worst. More people poured into a leaky funnel mostly leak out of the same hole.
Define the steps. Three to five, each a thing the business can count: a call, a visit, a quote sent, a booking, a payment. Write down what counts as reaching each step, so the same rule is used every month.
Count each step over one period. The same month, the same people. A booking this month from a quote sent last month belongs to last month's funnel, or the rates will mislead.
Work out each onward rate. The next step's count over this step's count, times a hundred.
Find the worst leak. The lowest onward rate, wherever it falls.
Work out the people lost and the end-to-end rate. Lost is each count less the next; end-to-end is the last count over the first, times a hundred.
Look for the reason at the worst step. Ask people who stopped there, watch the step, read the form on a phone.
Check the answer. Every count must be no larger than the one before it, so every onward rate is a hundred percent or less. The people lost at the three steps, added to the last count, must give the first count. And the three onward rates, as decimals multiplied together, must give the end-to-end rate.
Dividing each count by the one just before it is allowed because the steps are consecutive: everyone at the next step came from this one. That makes each rate a fair measure of this step alone, untouched by how many people arrived at the top.
Comparing rates rather than counts is needed because the counts shrink at every step, so the top step nearly always loses the most people. A rate asks a fairer question: of the people who got this far, what share went on?
Multiplying the rates to get the end-to-end rate is allowed because each rate is a share of the one before. Forty percent of the visitors, then half of those, then a quarter of those, is 0.4 × 0.5 × 0.25 of the visitors. That is also why a fix at any step lifts the whole funnel by the same factor.
A low rate says where people stop, not why. The why is usually found by looking at the step through a customer's eyes. Maya ordered from her own shop on her phone and found that shipping, 14 dollars, appeared only on the last screen; a customer who had planned to spend 40 dollars was suddenly asked for 54. Bright Home Cleaning found that written quotes went out only when the owner had a free evening, sometimes a week after the visit, by which time the tenant had booked someone else.
Both fixes were cheap: show shipping on the product page, and write the quote before leaving the visit. Neither needed one more visitor or one more advert. Most leaks in a small business are like this: a delay, a surprise or a missing option at one step, found by walking through it.
Work the funnel out every month from the same records, and keep the rates in a simple table. A rate that falls suddenly is an alarm: the checkout rate dropping from 25 to 10 percent in one month usually means something broke, such as a payment option failing, not that customers changed their minds. A rate that creeps up after a fix is the proof that the fix worked.
Small funnels jump about from month to month by chance. A step with 12 people can swing from 50 to 25 percent because three people chose differently. Before acting on a change in a small funnel, look at two or three months together, or wait for the change to repeat.
A funnel is not only for online shops. A market stall, a repair shop or a cleaning service has one too; its steps are simply counted by hand. Monica can tally on a clipboard how many shoppers stopped, picked something up, asked a price and bought. Northside Repairs can count calls, bikes dropped off, estimates accepted and repairs collected from its ticket book.
The rule is the same: steps that follow each other, each counted the same way every time, over the same period. A hand count of a single busy Saturday is a start. Four Saturdays of hand counts, added together, give rates steady enough to act on, and they cost nothing but a pencil and the habit of making a mark at each step. The worst leak found this way is just as real as one found by software, and usually just as cheap to fix.
A landscaping company in Tucson spent more on online advertising every spring, and bookings barely rose. The owner finally built a funnel from the office's records for one month: 300 people filled in the website form, 240 were called back, 90 had a site visit, 60 received a written estimate, and 45 booked.
The onward rates were 80 percent from form to callback, 37.5 percent from callback to site visit, about 67 percent from visit to estimate, and 75 percent from estimate to booking. The worst leak was the callback, and the reason was simple once someone listened to the calls: callbacks were made two or three days after the form, by which time many homeowners had booked a visit with whoever called first.
The company set a rule that every form gets a call within two business hours. The next month, from a similar 300 forms, 150 site visits were booked, and bookings rose from 45 to about 70, with no increase in advertising. The money that would have gone into more ads paid for a part-time scheduler instead.
Online retailers track the share of shoppers who start checkout and do not finish, and industry studies have long put it at around seven in ten. The reasons shoppers most often give are extra costs shown late, such as shipping and taxes, and having to create an account. Those are exactly the kind of specific, fixable causes that a funnel's worst step points to.
The largest drop is the failure. The largest raw drop is usually at the top; the worst rate may be anywhere.
More visitors fix a weak funnel. They mostly leak out of the same step.
Any list of numbers is a funnel. Steps must be defined, consecutive and counted from records.
The last step is always the problem. Sometimes it is the strongest; read all the rates.
A low rate explains itself. It says where to look; the reason is found by walking through the step.
Define and count the steps.
$400; \ 160; \ 120; \ 96$
Stopped, picked up, asked a price, bought.
Work out the first rate.
$160 \div 400 \times 100 = 40$
Picked up over stopped.
Work out the second rate.
$120 \div 160 \times 100 = 75$
Asked over picked up.
Work out the third rate.
$96 \div 120 \times 100 = 80$
Bought over asked.
Find the worst leak.
$40 \text{ percent, the first step}$
Here it is also the largest drop.
Count the steps from the booking book.
$80; \ 64; \ 16; \ 12$
Asked, visited, quoted, booked.
Work out the first rate.
$64 \div 80 \times 100 = 80$
Visits over requests.
Work out the second rate.
$16 \div 64 \times 100 = 25$
Quotes over visits.
Work out the third rate.
$12 \div 16 \times 100 = 75$
Bookings over quotes.
Find the worst leak.
$25 \text{ percent, visit to quote}$
Most visits never produce a quote.
Find the reason.
$\text{quotes written only on free evenings}$
Something specific inside the business.
Count the steps.
$1000; \ 400; \ 200; \ 50$
Visited, product page, checkout, paid.
Work out the three rates.
$40; \ 50; \ 25$
Each over the step before.
Find the worst leak.
$25 \text{ percent at checkout}$
Not the 600 lost at the top.
Work out the end-to-end rate.
$0.4 \times 0.5 \times 0.25 = 0.05$
Five percent of visitors paid.
Find and fix the reason.
$\text{show shipping on the product page}$
The surprise charge was the leak.
Count the next month's checkout step.
$90 \div 200 \times 100 = 45$
Same visitors, better checkout.
Work out the new end-to-end rate.
$0.4 \times 0.5 \times 0.45 = 0.09$
Nearly double, with no more traffic.
Work out the first rate: 800 saw the post, 200 opened the page.
$200 \div 800 \times 100 = 25$
Opened over saw.
Work out the next two: 150 added a meal, 60 paid.
$150 \div 200 \times 100 = 75; \ 60 \div 150 \times 100 = 40$
Each over the step before.
Find the worst leak.
For the new online lunch pre-order at Neighborhood Kitchen, $800$ people saw the lunch menu post, $200$ opened the order page, $150$ added a meal to the cart and $60$ paid for the order. At which step does the funnel leak worst?
Complete the worked solution: $600$ people saw Neighborhood Kitchen's lunch post. $70$ percent of them opened the order page, $50$ percent of those added a meal to the cart, and $20$ percent of those paid. Find how many reached each step and the end-to-end rate.
Find how many opened the order page.
$(\text{saw}) \times (\text{first rate}) \div \text{a hundred} =$ b
An onward rate is a share of the step before.
Find how many added a meal.
$(\text{opened}) \times (\text{second rate}) \div \text{a hundred} =$ c
Each rate applies to the step just before it.
Find how many paid.
$(\text{added}) \times (\text{third rate}) \div \text{a hundred} =$ d
The last step of the funnel.
Find the end-to-end rate.
$(\text{paid}) \div (\text{saw}) \times \text{a hundred} =$ e
The share of the first step who reached the last.
For repair jobs at Northside Repairs, $120$ people brought an item in, $60$ approved the estimate, $48$ collected and paid and $12$ came back with another job within a year. Fill in the percentage who went on from each step to the next.
| Went on, percent | |
|---|---|
| First to second | |
| Second to third | |
| Third to fourth |
For the online shop at Maya's Ceramics, $1000$ people visited the shop, $400$ opened a product page, $200$ started to check out and $50$ paid. What percentage of those at the first step reached the last?
Answer:
Bright Home Cleaning's month: $75$ people asked for a quote, $30$ had a walk-through visit, $15$ received a written quote and $5$ booked. Plot the count at each of the four steps.
Plot your answer on the grid:
A dental office in Raleigh tracked new patients for a quarter: $500$ called, $400$ booked a first visit, $280$ came to the visit, and $252$ accepted a treatment plan. What is the onward rate, as a percentage, at the step where the funnel leaks worst?
Answer:
A gym's trial-pass funnel: $1500$ people saw the offer, $300$ collected a free pass, $240$ used it, and $60$ joined. Which step should the gym work on first?
Lesson test: one question per skill, one attempt each, no hints. Your answers are checked when you submit.
For a Saturday's passing shoppers at Monica's Market Stall, $400$ people stopped at the stall, $160$ picked something up, $120$ asked a price and $96$ bought. How many people were lost at the step with the lowest onward rate?
Answer:
You can read a funnel by its rates and say which step to fix first. Tell someone why pouring more visitors into a leaky funnel rarely helps. Next: the sales conversation itself.
17. Your turn: Neighborhood Kitchen's lunch pre-order, step 3
$25 \text{ percent, post to page}$
The lowest of the three.