Back to the on-screen lesson ·
A line grows by the gap between arrivals and what a step finishes, every hour the gap lasts; a step close to full has long, lumpy lines, and only more capacity or fewer arrivals shortens one.
Paper packet. Every task here also exists on screen, where it is checked automatically; answers written on paper are not assessed by Nydus. When you are back at a device, enter your answers there.
You will explain a line as arrivals outpacing a step, compute how busy the step is, how fast its line grows and how long it is after a rush, plot it growing, and choose a change that actually shortens it.
You can work out what a step can finish in an hour. Customers do not arrive at that rate on cue. When they arrive faster, they wait, and the waiting is a line.
| Term | What it means |
|---|---|
| Arrival rate | How many people or jobs reach a step in an hour. |
| Service rate | How many the step can finish in an hour: its capacity. |
| Utilization | Arrivals over capacity, as a percentage: how busy the step is. |
| Line | The people or jobs waiting. |
| Growth | Arrivals less service, each hour. |
| Clearing time | How long a line takes to empty once arrivals drop. |
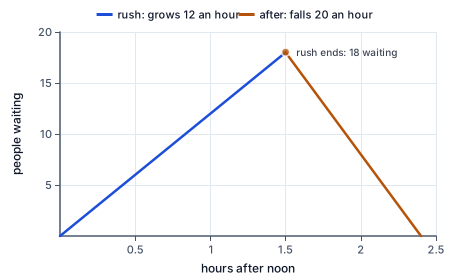
At lunchtime about 72 customers an hour reach Neighborhood Kitchen's register, and the register can serve 60. Each hour, 12 more arrive than are served, and they wait. After an hour, 12 are waiting; after an hour and a half, 18.
$$\text{line growth per hour} = \text{arrivals} - \text{what the step finishes}$$
How busy the register is: 72 ÷ 60 × 100 = 120 percent. Anything over 100 percent means the line grows for as long as the rush lasts, and no amount of hurrying or apologizing changes that: only a faster register, a second register, or fewer people arriving at once.
Many common fixes do nothing to the arithmetic. A bigger waiting area holds more of the line. A sign apologizing makes the wait feel better. Numbered tickets make it fairer. Each can be worth doing, and none of them changes how many are served each hour.
Another way: table
Neighborhood Kitchen's register at lunchtime.
| Per hour | |
|---|---|
| Customers arriving | 72 |
| Customers the register serves | 60 |
| Line grows by | 12 |
| How busy the register is | 120 percent |
Another way: steps
It is tempting to aim for a step that is exactly as busy as it can be, at 100 percent, because nothing is wasted. In practice arrivals are lumpy: people come in bursts, and some take longer than others. A step running at 95 percent on average spends parts of every hour above 100 percent, and its line grows in those parts and has almost no slack to clear afterwards. The result is a line that seems to appear from nowhere and linger for ages.
So a step that customers line up for should normally have spare room: a register that can serve 60 an hour copes comfortably with 45 or 50 arriving, and struggles badly with 58.
Count arrivals. At the step, during the busy period, in fifteen-minute blocks. A tally on a clipboard is enough; multiply a fifteen-minute count by four for an hourly rate.
Work out capacity. From the capacity lesson: sixty times the people over the minutes a customer takes.
Work out how busy. Arrivals over capacity, times a hundred.
Work out the growth. Arrivals less capacity, each hour. If it is negative, the line shrinks by that much.
Work out the line. Growth times the hours of the rush, starting from whatever line there was at the start.
Choose a fix. More capacity at that hour, or fewer arrivals at once.
Check against the floor. Count the line at the end of the rush and compare with the figure. If the real line is shorter, some people gave up and left, which is a cost of its own. If it is longer, either arrivals were higher or service slower than the counts showed.
Taking the difference of the two rates is allowed because each hour, arrivals add people to the line and service removes them. What is left after an hour is what arrived less what was served, added to whatever was there before.
Multiplying by the hours is allowed when the two rates stay about the same through the rush. If arrivals change partway, work out each part separately and add the results, as the chart does when the rush ends.
Ignoring fixes that do not change either rate is allowed because they cannot change the difference. A bigger waiting area changes where the line stands, not how fast it grows.
When the rush ends, the line does not vanish. If arrivals drop to 40 an hour and the register still serves 60, the line shrinks by 20 an hour. Eighteen people waiting at half past one take 18 ÷ 20, just under an hour, to clear. Customers who arrive at a quarter to two still find a line, even though the rush is over.
This is why lines feel worse than the arithmetic of the rush alone suggests: they outlast it. A business that adds a second register only for the peak half-hour may find the line still there at two o'clock; keeping it open until the line clears is part of the fix.
Sometimes the cheaper fix is to change when people arrive, not how fast they are served. Neighborhood Kitchen can take pre-orders for collection at set times, so a third of the lunch customers arrive at 11:45 or 1:15 instead of 12:30. A repair shop can book drop-offs in fifteen-minute slots on Monday morning instead of letting everyone come at opening. A cleaning company can stagger client calls by asking for a preferred callback time.
Each of these lowers the arrival rate at the peak without adding capacity. The arithmetic is the same: if peak arrivals fall below what the step can serve, the line stops growing.
Not every line has people standing in it. Phone calls waiting on hold, emails waiting for a reply, bikes waiting in the rack and orders waiting to be packed are all lines, and they grow by the same arithmetic. A repair shop with eight bikes in the rack and a mechanic who finishes two an hour has a four-hour line, whether or not anyone is waiting at the counter.
Count these lines too. They decide how long a customer waits for the result, which is often what they complain about. The same two rates, arrivals and service, tell the owner whether the line will grow or shrink today.
While the rates are being fixed, the wait can still be made easier. Tell people how long it will be, honestly. Let them do something useful while waiting, such as filling in the drop-off form or looking at the menu. Serve in a clear order so nobody feels skipped.
These matter, because a wait that is explained and fair feels shorter than one that is not. But they are not the fix. If arrivals stay above capacity, the line keeps growing, and the most pleasant waiting area in town will not stop people giving up and leaving. Do both: make the wait decent now, and change the rates for next week.
A long line loses customers. Some look at it and walk past; others join, wait a few minutes and leave. Either way the sale is gone, and often the next visit too. These lost customers make the line look shorter than the arithmetic says, which can fool an owner into thinking the problem is smaller than it is.
Count them when you count arrivals: a tally of people who looked in and left, or who left the line. If the arithmetic says 18 should be waiting and only 10 are, roughly 8 people gave up, and at an average order of 12 dollars, that is about a hundred dollars of lunch lost in one rush. A figure like that makes the case for a second register far better than the length of the line alone.
Lines change as the business changes. A new office building opens nearby and lunch arrivals jump; a new menu item takes longer to make and the register's capacity falls. Count arrivals and the line at the busiest hour once a week, and write both down next to the step's capacity.
When arrivals start creeping toward capacity, say past 85 percent, plan the fix before the line appears: book extra help for that hour, open pre-orders, or simplify the slowest item. Acting at 85 percent is cheap; acting at 120 percent, after regulars have started going elsewhere, is not.
A bagel shop in Tampa had a line out the door from 7:30 to 8:30 every weekday. The owner counted for a week: about 90 customers arrived in that hour, and the counter, with two people taking orders and making bagels, served about 70. The line grew by 20 in the hour and took another 40 minutes to clear, by which time some regulars had started going elsewhere.
Rather than hire a third person for one hour a day, the owner added online ordering with pickup slots every ten minutes from 7:00, capped at eight orders a slot, and prepared those orders between walk-in customers in the quieter half hour before 7:30. About a quarter of the morning customers moved to the slots, many of them earlier.
Walk-in arrivals in the peak hour fell to about 65, below the counter's 70. The line stopped growing, the morning sales held steady, and the regulars came back. The counter was no faster; the arrivals were spread.
The mathematics of waiting lines, called queueing theory, was developed for telephone exchanges in the early twentieth century and is now used by banks, hospitals and call centers. One of its main results is the one in this lesson: as a server's utilization approaches one hundred percent, average waits grow very quickly, which is why well-run services keep spare capacity at their busiest steps.
Lines are caused by impatient customers. They are caused by arrivals outpacing service.
More space for the line fixes it. It holds a longer line.
A step at 100 percent is efficient. With lumpy arrivals, it guarantees long waits.
If we hurry, the line will clear. Only if what is finished each hour rises above what arrives.
The line ends when the rush ends. It takes time to clear afterwards.
Count the arrivals.
$20 \text{ calls an hour}$
Monday morning.
Work out the capacity.
$16 \text{ calls an hour}$
One person, under 4 minutes a call.
Work out how busy.
$20 \div 16 \times 100 = 125$
Over a hundred.
Work out the growth.
$20 - 16 = 4$
Calls an hour.
Work out the line after 2.5 hours.
$4 \times 2.5 = 10$
Callers waiting or giving up.
Count the arrivals.
$15 \text{ an hour}$
Monday morning drop-offs.
Work out the capacity.
$60 \div 5 = 12$
Five minutes a bike.
Work out how busy.
$15 \div 12 \times 100 = 125$
Over a hundred.
Work out the line after three hours.
$(15 - 12) \times 3 = 9$
People waiting.
Choose a fix.
$\text{a form filled in while waiting: 4 minutes}$
Check-in shortened.
Work out the new capacity.
$60 \div 4 = 15$
Equal to arrivals: no growth.
Count the arrivals.
$72 \text{ an hour}$
Lunch rush.
Note the capacity.
$60 \text{ an hour}$
One register.
Work out the growth.
$72 - 60 = 12$
Each hour.
Work out the line when the rush ends.
$12 \times 1.5 = 18$
After an hour and a half.
Work out the clearing rate.
$60 - 40 = 20$
Arrivals drop to 40.
Work out the clearing time.
$18 \div 20 = 0.9$
Just under an hour.
Choose a fix.
$\text{pre-orders for 11:45 and 1:15}$
Arrivals spread.
Work out how busy the register is.
$30 \div 24 \times 100 = 125$
30 arrive, 24 served an hour.
Work out the growth.
$30 - 24 = 6$
Each hour.
Work out the line after two hours.
At lunchtime $65$ customers an hour arrive at Neighborhood Kitchen's register, which can serve $59$ an hour. Which change would stop the line growing?
Complete the worked solution: at Neighborhood Kitchen's breakfast counter, about $61$ customers an hour arrive during the morning rush, and the counter can serve $50$ an hour. The rush lasts $3$ hours and there is no line at the start. Find how busy the counter is as a percentage, how much the line grows each hour, and the line at the end of the rush.
Find how busy the counter is.
$(\text{arrivals}) \div (\text{capacity}) \times \text{a hundred} =$ u
Over a hundred means a growing line.
Find the growth each hour.
$(\text{arrivals}) - (\text{capacity}) =$ g
More arrive than are served.
Find the line at the end.
$(\text{growth}) \times (\text{hours}) =$ q
The gap, added up over the rush.
Say what would stop it growing.
$\text{serving at least as many as arrive}$
Only capacity or arrivals change it.
At Bright Home Cleaning, people arrive at the booking phone on Monday at about $20$ an hour, and it can finish $16$ an hour. How busy is the step, as a percentage of what it can finish?
Answer:
At Maya's Ceramics, people arrive at the register at the Christmas fair at about $30$ an hour, and it can finish $24$ an hour. The rush lasts $4$ hours and there is no line at the start. How many people are waiting at the end of it?
Answer:
Customers arrive at Monica's stall at $24$ an hour on Saturday morning, and the stall serves $20$ an hour. There is no line at eight o'clock. Plot the line after $1$, $2$ and $3$ hours.
Plot your answer on the grid:
A pharmacy in Orlando has a pickup counter staffed by $2$ technicians, each taking $3$ minutes a customer. From five to seven in the evening, about $51$ customers an hour arrive. There is no line at five o'clock. How many people are waiting at seven? Fill in each figure on the sheet.
| Amount | |
|---|---|
| Growth in the line each hour | |
| People waiting after two hours |
A post office counter always has a long line at lunchtime. Mark every explanation that accounts for it.
This task has no paper form; do it on a device.
Lesson test: one question per skill, one attempt each, no hints. Your answers are checked when you submit.
At Bright Home Cleaning, people arrive at the booking phone on Monday at about $20$ an hour, and it can finish $16$ an hour. The rush lasts $2.5$ hours. Fill in how busy the step is (percent), how many the line grows by each hour, and the line at the end of the rush.
| Value | |
|---|---|
| How busy, percent | |
| Growth each hour | |
| Line at the end |
You can say why a line forms and how long it will get from two rates. Tell someone why a bigger waiting area does not shorten a line. Next: planning for the peak that comes every week.
20. Your turn: Maya's open studio day, step 3
$6 \times 2 = 12$
People waiting to pay.