Back to the on-screen lesson ·
Sensitivity moves one forecast assumption at a time — volume, price, variable cost — and recomputes the profit; fixed costs make profit fall much faster than the assumption, the biggest loss marks the assumption to watch, and the switch point says how far it can move before the month breaks even.
Paper packet. Every task here also exists on screen, where it is checked automatically; answers written on paper are not assessed by Nydus. When you are back at a device, enter your answers there.
You will recompute a forecast's profit with volume, price and variable cost each moved on its own, compare the losses, name the assumption the plan is most sensitive to, work out how far volume can fall before break-even, and plot profit against volume.
A forecast works out a profit from four assumptions, and labels which of them are hopes. Assumptions are often wrong. Sensitivity asks how wrong they can be before the plan breaks, and which one matters most.
| Term | What it means |
|---|---|
| Sensitivity | How much the result changes when one assumption changes, with the others held still. |
| One-at-a-time test | Changing a single assumption — volume down 20 percent, say — and recomputing. |
| Most sensitive assumption | The one whose realistic change moves the profit most. |
| Switch point | How far an assumption can move before the profit reaches zero. |
| Operating leverage | The way fixed costs make profit swing by a larger share than sales do. |
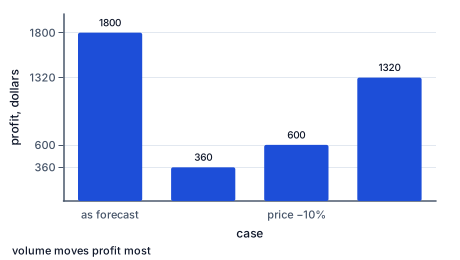
Neighborhood Kitchen forecasts 1,200 lunches at 10 dollars, variable cost 4, fixed costs 5,400: profit 1,800 dollars. Now move one assumption at a time.
Volume 20 percent lower — 960 lunches: 6 × 960 − 5,400 = 360 dollars. A fifth less volume took four fifths of the profit, because the fixed costs did not fall.
Price 10 percent lower — 9 dollars a lunch: contribution falls from 6 to 5, and 5 × 1,200 − 5,400 = 600 dollars. A tenth off the price took two thirds of the profit, because it came straight out of every lunch's contribution.
Variable cost 10 percent higher — 4.40 a lunch: contribution 5.60, and 5.60 × 1,200 − 5,400 = 1,320 dollars.
Which hurts most depends on the business. For the kitchen, the volume fall leaves 360, the price fall 600 and the cost rise 1,320, so volume is the biggest risk. For Monica's stall, where each basket contributes only 5 of its 16 dollars, a 10 percent price cut turns a 1,500-dollar profit into a 100-dollar loss — price is the danger. The test finds out; intuition often guesses wrong.
Another way: table
Neighborhood Kitchen, one assumption at a time.
| Case | Profit |
|---|---|
| As forecast | 1,800 |
| Volume 20 percent lower | 360 |
| Price 10 percent lower | 600 |
| Variable cost 10 percent higher | 1,320 |
Another way: steps
Choose realistic sizes. The best test size is one the business has actually seen: the fall in volume in its worst month last year, the price cut a competitor forced, the rise in a supplier's prices. Made-up sizes test the arithmetic, not the plan.
Move one at a time. Change volume and keep price and costs; then change price and keep the others; then costs. Moving two at once hides which one did the damage.
Recompute from the rule. Contribution a unit times volume, less fixed costs, with the one changed figure put in.
Compare and name. The case with the lowest profit names the most sensitive assumption.
Check each case by the direction it must move: less volume, a lower price or a higher cost can only lower the profit, so a case that comes out higher has an arithmetic error. Check the volume case another way too: the profit lost must equal the lost units times the contribution a unit.
Profit is what is left after fixed costs, and fixed costs do not move when volume or price does. So a percentage change in volume or price produces a much larger percentage change in profit. This is called operating leverage: the higher the fixed costs compared with the profit, the harder the profit swings.
Plot profit against volume and it is a straight line whose slope is the contribution a unit: steep lines — high contribution — lose profit fast when volume falls. A price cut does something different: it makes the line itself shallower, taking the same amount off every unit, which is why low-contribution businesses are most exposed to price.
A one-at-a-time test asks what happens at a given change. A switch point asks the question the other way round: how far can this assumption move before the profit reaches zero? For volume it is the margin of safety: the kitchen breaks even at 900 lunches, so volume can fall by 300, a quarter of the forecast. For price it is the price at which the contribution just covers the fixed costs at the forecast volume: 4 + 5,400 ÷ 1,200 = 8.50, a fall of 15 percent.
Switch points are easier to judge than profits. An owner may not know whether 600 dollars of profit is worrying, but she knows whether her lunch trade has ever fallen by a quarter in a month, or whether she has ever had to cut prices by 15 percent. A switch point well beyond anything the business has seen is comfortable; one inside the normal swing of the business is a warning.
Use the test to decide where to be careful. The assumption the plan is most sensitive to is the one to check hardest before committing, to watch through a leading measure afterwards, and to protect — by not cutting the price lightly if price is the danger, by keeping fixed costs low if volume is, by agreeing a fixed price with a supplier if costs are.
It also shows where effort pays most. If profit is twice as sensitive to price as to cost, a small, well-explained price rise does more for the business than a long hunt for cheaper supplies.
Assumptions do not always move alone. A recession lowers volume and forces price cuts together; a busy season raises volume and pushes up staff costs. One-at-a-time tests find the most sensitive assumption, but they understate what happens when two go wrong at once. The next lesson combines several changes into scenarios — a bad month, a good month — to cover that.
The results of a sensitivity test are easiest to use when they are set out as a small table with the same test sizes every time: volume down by the business's worst recent month, price down by the largest discount it has been forced into, variable cost up by the largest supplier rise it has seen. Kept that way, next quarter's table can be set beside this quarter's, and a change in the ranking is a signal. If price has moved from the second-largest risk to the largest, something has changed — perhaps the contribution a unit has thinned — and the owner should find out what.
A good table also shows the percentage change in profit beside each case, because that is the figure owners remember. 'A fifth less volume takes four fifths of the profit' sticks in a way that '360 dollars' does not. It also shows the effect of fixed costs plainly: the higher the fixed costs relative to the profit, the larger every percentage in the table.
Sensitivity tables are not only for bad news. A price rise of 5 percent tested the same way shows what the business gains if customers accept it, and the switch point shows how many customers could leave before the rise loses money. For Neighborhood Kitchen, a price of 10.50 adds 50 cents of contribution to every lunch: 600 dollars on 1,200 lunches. Volume could fall to (1,800 + 5,400) ÷ 6.50, about 1,108 lunches, before the month earned less than the original 1,800 — a fall of about 8 percent, roughly one customer in twelve. That is the real question a price rise asks: will fewer than one lunch customer in twelve walk away? If the owner's evidence says yes, the rise is a sound move.
The habit worth building is to run the table before any decision that changes a price, a cost or a commitment, and after any month that surprised the owner. It takes ten minutes with the forecast rule, and it replaces a vague worry with a ranked list of what actually matters.
A food-truck owner planning a second truck forecast 2,400 meals a month at 12 dollars, with 5 dollars of food and packaging in each and 11,000 of fixed costs including the new truck's loan: a profit of 5,800. The bank asked what would happen if things went wrong, so she tested each assumption on its own.
With meals 20 percent lower, profit fell to 7 × 1,920 − 11,000 = 2,440. With the price 10 percent lower, to (10.80 − 5) × 2,400 − 11,000 = 2,920. With food costs 10 percent higher, to (12 − 5.50) × 2,400 − 11,000 = 4,600. Volume was the danger, and its switch point was 11,000 ÷ 7, about 1,571 meals, a fall of about 35 percent.
Her records showed that her first truck's worst month, in January, had been 30 percent below its average. A second truck opening in winter could come close to the switch point in its first months. She asked the bank to start the loan repayments in April, booked the second truck for three office-park lunches a week to secure a base of volume, and kept the price where it was. The truck's first January came in 26 percent below forecast, and still made a small profit.
Banks test their own plans, and the businesses they lend to, against bad cases: a fall in sales, a rise in costs, a rise in interest rates. The one-at-a-time test in this lesson is the simplest version, and a small business that brings its own to a loan meeting has answered the lender's first question before it is asked.
A 10 percent fall in sales means 10 percent less profit. Fixed costs make the profit fall much further.
Price cuts are a safe way to win volume. They come off every unit's contribution.
Test everything at once. Change one assumption at a time to see which matters.
Any size of change will do. Test the changes the business has actually seen.
One forecast is enough. Without sensitivity, nobody knows how fragile it is.
A cost rise and a price cut of the same size hurt the same. A 10 percent price cut takes more, because the price is larger than the variable cost it is a share of.
Sensitivity is for pessimists. The same table shows what a small, well-chosen price rise would add, and how many customers could leave before it stopped paying.
Start from the forecast.
$(16 - 11) \times 1000 - 3500 = 1500$
1,000 baskets at 16, variable cost 11.
Move volume down 20 percent.
$5 \times 800 - 3500 = 500$
Price and costs unchanged.
Move price down 10 percent.
$(14.40 - 11) \times 1000 - 3500 = -100$
Volume and costs unchanged.
Compare the losses.
$1000 \text{ against } 1600$
Price is the danger.
Decide how to protect it.
$\text{never match the supermarket's promotions}$
The most sensitive assumption guides the decision.
Find the contribution a lunch.
$10 - 4 = 6$
Price less variable cost.
Find the break-even volume.
$5400 \div 6 = 900$
Fixed costs over contribution.
Find the volume switch point.
$(1200 - 900) \div 1200 = 25 \text{ percent}$
How far volume can fall.
Find the break-even price at the forecast volume.
$4 + 5400 \div 1200 = 8.50$
Contribution just covers fixed costs.
Find the price switch point.
$(10 - 8.50) \div 10 = 15 \text{ percent}$
How far price can fall.
Compare with the records.
$\text{worst month: volume down 12 percent}$
Well inside the switch point.
Start from the forecast.
$(90 - 50) \times 160 - 4800 = 1600$
160 cleans at 90, variable cost 50.
Move volume down 20 percent.
$40 \times 128 - 4800 = 320$
32 fewer cleans.
Move price down 10 percent.
$(81 - 50) \times 160 - 4800 = 160$
Nine dollars off every clean.
Move variable cost up 10 percent.
$(90 - 55) \times 160 - 4800 = 800$
Supplies and wages up.
Rank the losses.
$1440, \ 1280, \ 800$
Price first, then volume, then cost.
Find the price switch point.
$50 + 4800 \div 160 = 80$
About 11 percent below 90.
Decide how to protect it.
$\text{no discounting; the guarantee justifies the price}$
Price is the assumption to guard.
Move volume down 20 percent.
$25 \times 120 - 2500 = 500$
150 repairs at 60, variable cost 35, fixed 2,500.
Move price down 10 percent.
$(54 - 35) \times 150 - 2500 = 350$
Six dollars off every repair.
Name the most sensitive assumption.
Neighborhood Kitchen forecasts $1200$ lunches a month at $10$ dollars each, with a variable cost of $4$ dollars a unit and fixed costs of $5400$ dollars, for a profit of $1800$ dollars. What would the profit be if volume were 20 percent lower, everything else unchanged?
Answer:
Complete the worked solution: a business forecasts $500$ units a month at $11$ dollars each, with a variable cost of $3$ a unit and fixed costs of $2400$. Find how far volume can fall before the month breaks even.
Take the variable cost from the price.
$11 - 3 =$ m
Contribution a unit.
Divide the fixed costs by it.
$2400 \div (\text{contribution}) =$ e
Break-even volume.
Take break-even from the forecast.
$500 - (\text{break-even}) =$ g
Units the month can lose.
Express it as a share of the forecast.
$(\text{units}) \div 500 \times 100 =$ h
The volume switch point, in percent.
Compare it with a bad month.
$\text{has volume ever fallen that far?}$
The records say how real the risk is.
Monica's Market Stall forecasts $1000$ baskets a month at $16$ dollars each, with a variable cost of $11$ dollars a unit and fixed costs of $3500$ dollars, for a profit of $1500$ dollars. What would the profit be if the price had to fall 10 percent, everything else unchanged?
Answer:
Bright Home Cleaning forecasts $160$ cleans a month at $90$ dollars each, with a variable cost of $50$ dollars a unit and fixed costs of $4800$ dollars, for a profit of $1600$ dollars. With volume 20 percent lower the profit would be $320$; with price 10 percent lower, $160$. Which of those two changes hurts the plan more?
Monica's Market Stall forecasts $1000$ baskets a month at $16$ dollars each, with a variable cost of $11$ dollars a unit and fixed costs of $3500$ dollars, for a profit of $1500$ dollars. Fill in the profit, in dollars, for the forecast as it stands, with volume 20 percent lower, and with price 10 percent lower.
| Profit, dollars | |
|---|---|
| As forecast | |
| Volume 20 percent lower | |
| Price 10 percent lower |
A bakery's loaves each contribute $2$ dollars and its fixed costs are $1000$ dollars a month. Plot the month's profit, in hundreds of dollars, at volumes of $6$, $9$ and $12$ hundred loaves.
Plot your answer on the grid:
A coffee cart forecasts $4500$ cups a month at $4$ dollars each, with $1$ of coffee, milk and cup in each, and fixed costs of $4400$ for the pitch, insurance and loan. Fill in the profit, in dollars, as forecast and with each assumption moved on its own.
| Amount | |
|---|---|
| Profit as forecast | |
| Cups 20 percent lower | |
| Price 10 percent lower | |
| Variable cost 10 percent higher |
Lesson test: one question per skill, one attempt each, no hints. Your answers are checked when you submit.
Maya's Ceramics forecasts $300$ mugs a month at $28$ dollars each, with a variable cost of $10$ dollars a unit and fixed costs of $3600$ dollars, for a profit of $1800$ dollars. If the price had to fall 10 percent, the profit would be $960$ dollars. Complete the sentence.
A 10 percent price cut would cost l dollars of profit a month.
You can find the assumption a plan depends on most, and show it in dollars and as a switch point. Tell someone why a small price cut can hurt more than a bigger fall in sales. Next: comparing whole scenarios.
17. Your turn: Northside Repairs, step 3
$\text{price, by a little}$
It leaves the lower profit.