Back to the on-screen lesson ·
Heme sites, the Hill model, and oxygen release between two equilibrium pressures.
Paper packet. Every task here also exists on screen, where it is checked automatically; answers written on paper are not assessed by Nydus. When you are back at a device, enter your answers there.
Calculate site occupancy with a stated Hill model and distinguish capacity, affinity and oxygen release.
You can distinguish a ligand from its metal center and an equilibrium constant from a rate constant. Here oxygen is a ligand, and a protein controls the environment around the metal. Review fractions and percentages: a fraction of 0.8 is eighty percent, while multiplying a capacity by eighty would overestimate its occupied sites one hundred times. Pressure replaces dissolved oxygen concentration only within a stated equilibrium model at fixed conditions.
| Term | What it means |
|---|---|
| Heme | An iron-containing porphyrin group held within a protein. |
| Fractional saturation | The fraction of available oxygen-binding sites that are occupied, written Y. |
| Half-saturation pressure | The oxygen partial pressure P50 at which half the available sites are occupied. |
| Cooperativity | A change in the affinity of remaining sites when another site binds a ligand. |
| Hill exponent | An empirical measure of the steepness of binding over the fitted range, not a count of hemes. |
| Capacity | The amount of oxygen that would be bound if every available site were occupied. |
An oxygen carrier must solve two competing problems. It needs to bind oxygen where oxygen is abundant and release it where oxygen is scarce. Binding as strongly as possible is therefore not automatically the best design for transport. A carrier that stays almost fully occupied at both locations moves little oxygen between them, even though its high affinity might initially sound desirable. The useful quantity is the difference between its occupancies at the two pressures.
Myoglobin contains one heme and provides a useful example of reversible binding at a single site. Hemoglobin contains four hemes in interacting protein subunits. Each heme can bind one oxygen molecule; the four iron centers do not share a single oxygen molecule. Binding at one subunit can change the affinity of sites in the others. This communication produces cooperative behavior and helps explain why a binding curve can become especially steep over part of its range.
In a heme site, four porphyrin nitrogen donors surround iron. A histidine nitrogen supplies an axial donor, and oxygen can occupy another coordination position. The protein is consequently more than packaging: it places donors, limits access and couples local structural changes to the rest of the molecule. Coordination chemistry and protein structure jointly control function. This lesson follows equilibrium occupancy rather than the detailed electronic structure of the iron-oxygen bond.
Write fractional saturation as $Y$. An independent-site model gives $Y=p/(P_{50}+p)$. A convenient empirical extension is the Hill model, $Y=r^n/(1+r^n)$ with $r=p/P_{50}$. Both pressures must use the same units. The exponent is dimensionless. These equations count the fraction of occupied sites, not the fraction of oxygen in the surrounding gas that has disappeared.
Another way: steps
Identify the oxygen partial pressure and half-saturation pressure. Put them in the same unit and divide to obtain r. Raise r to the stated exponent. Divide that power by one plus the power. Multiply by one hundred for a percentage, or by the site capacity for an amount. When calculating release, repeat for the second pressure and subtract the bound amounts.
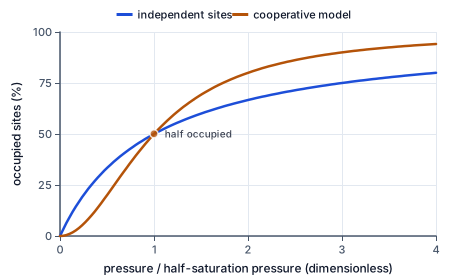
The horizontal axis is pressure divided by the half-saturation pressure. It is not time: moving right means comparing equilibria at progressively higher oxygen pressure, not following one sample as it binds. The vertical axis is the percentage of available sites occupied. Both curves pass through the marked fifty-percent point at a ratio of one. Their common midpoint was chosen deliberately so that the effect of the exponent can be examined without also changing affinity.
Below a ratio of one, squaring the ratio makes it smaller, so the cooperative model has lower occupancy than the independent-site model. Above one, squaring makes it larger, and the cooperative model has higher occupancy. The crossing does not mean the two models are identical. It means they share the same half-saturation pressure. A steeper middle region can support a greater occupancy change between two particular reservoirs, but that advantage depends on the reservoir pressures.
These plotted curves are invented comparisons. They are not measured myoglobin and hemoglobin curves: real proteins need their own fitted parameters, and their half-saturation pressures generally differ. Reading an empirical chart responsibly includes checking which variables were held constant. A comparison that changes both midpoint and exponent cannot attribute the whole effect to cooperativity alone.
At $p=P_{50}$ the ratio is one. Any positive exponent leaves that ratio equal to one, and normalization produces one half. The midpoint therefore has a direct interpretation that does not require knowing the exponent. For the same positive pressure and exponent, a smaller half-saturation pressure produces a larger ratio and greater occupancy. This is the sense in which a smaller midpoint pressure indicates greater oxygen affinity.
An exponent of one recovers independent-site binding. An exponent greater than one describes a steeper, positively cooperative response over the range being modeled. It does not mean that exactly that many oxygen molecules collide with the protein simultaneously. Nor does a noninteger exponent imply a fractional number of atoms or hemes. The equation is an empirical representation of average binding, not an elementary reaction equation.
A Hill plot uses the logarithm of the odds, $Y/(1-Y)$, against the logarithm of pressure. In the stated model the slope is n. A real protein need not have a single constant slope over its entire binding range. A fitted exponent is therefore a compact description whose range and conditions matter. We use integer exponents to make calculations transparent, not because real cooperative proteins must have integer slopes.
A sample with ten millimoles of available sites has a maximum bound-oxygen capacity of ten millimoles. At a fractional saturation of 0.6 it holds six millimoles. Doubling the number of otherwise identical carriers doubles this amount but does not change the fraction occupied at a given equilibrium pressure. Changing concentration and changing affinity are different interventions and should not be confused.
To model transport between reservoirs, first allow equilibrium at the high pressure, then equilibrium at the low pressure. The amount released from binding sites is capacity multiplied by the difference of fractional saturations. This is an accounting calculation between equilibrium endpoints. It does not specify how quickly the transfer occurs, how long the sample must remain in each reservoir, or whether equilibrium is reached in a moving fluid.
Dissolved oxygen is a separate contribution to the total oxygen present. Our exercises explicitly ignore it to isolate binding. Likewise, they assume every stated site remains available and the carrier is chemically unchanged. If sites are blocked, oxidized into a nonbinding form, or lost through denaturation, the available capacity must be reconsidered. A neat Hill calculation cannot replace those chemical facts. Always write what the capacity counts before multiplying by a saturation.
A half-saturation pressure belongs to stated conditions. Temperature, acidity and other bound species can change a protein's affinity. For hemoglobin, proton-linked changes help connect oxygen release to the chemical environment. A rightward shift of a saturation curve means a larger pressure is required for the same fractional occupancy. At a fixed pressure in the responsive region this corresponds to less oxygen bound, which can favor unloading.
The phrase rightward shift describes the data; explaining it requires the molecular interactions. A proton binds at a chemically defined site, changes the relative stability of conformations, and thereby alters oxygen binding. It is not sufficient to say that every acid directly pushes oxygen off iron. Distinguish the ligand at the heme from species acting elsewhere on the protein.
Oxygenation also must not be equated mechanically with irreversible oxidation. Reversible oxygen binding has a more complicated electronic description than a neutral ligand attached to a completely isolated iron ion. Oxidation to methemoglobin is a chemically different change that reduces useful oxygen-binding capacity. We do not assign a detailed oxidation-state picture from the Hill curve: equilibrium occupancy alone cannot settle that electronic-structure question.
Begin with the bounds. A fractional occupancy cannot be negative or exceed one, and the percentage must lie between zero and one hundred. At half-saturation pressure the answer must be fifty percent regardless of the positive exponent. Far below that pressure the occupied fraction approaches zero; far above it the fraction approaches one. These limits expose inverted ratios and missing denominators before any detailed arithmetic is checked.
Next compare the direction. Increasing pressure while keeping the model fixed must increase occupancy. Raising the half-saturation pressure while keeping pressure fixed must reduce it. For transport from a high-pressure reservoir to a low-pressure reservoir, the amount released should be positive and no greater than the total site capacity. A negative release usually means the subtraction order was reversed.
Finally check units and rounding. The pressure ratio and fractional occupancy have no units; an amount obtained by multiplying millimoles by occupancy remains in millimoles. Retain full precision through the two occupancy calculations and round the final difference only at the end. Subtracting two already rounded percentages can unnecessarily change the last digit. A correct numerical result should be accompanied by the assumptions that make its interpretation possible.
A research group in California evaluates an invented carrier in two sealed reservoirs. A sample has twenty millimoles of sites and an independent-site midpoint of ten kilopascals. At thirty kilopascals it is three quarters occupied and holds fifteen millimoles of oxygen. At ten kilopascals it is half occupied and holds ten millimoles. Five millimoles are released from its binding sites between those equilibria.
Now imagine another sample with twice as many identical sites. Both fractional saturations stay the same, but ten millimoles are released. This comparison isolates capacity. To investigate affinity instead, the researchers would keep the capacity fixed and change the midpoint parameter. They would also measure equilibration time separately: these two endpoint measurements cannot establish how quickly a carrier delivers oxygen. The apparatus is a model for reasoning about transport and does not establish that either carrier is suitable for use in a person.
A university laboratory in Colorado records a fifty-percent occupancy at twenty kilopascals before a sample is altered. Afterward, the same normalized binding curve is recovered but the maximum bound amount has fallen from eight to six millimoles. The midpoint has not moved: the result points to a loss of available capacity rather than a demonstrated affinity change. At half saturation the bound amounts would be four and three millimoles respectively.
If instead the maximum remained eight millimoles while the midpoint increased, the evidence would support a change in affinity under the new conditions. A complete interpretation needs both an absolute amount measurement and a normalized saturation curve. Normalizing every trace to its own maximum can hide lost sites. This is why a graph's axis definitions matter chemically, not just cosmetically.
The number of sites is a structural fact; the Hill exponent describes a response curve. A protein can possess multiple sites whose binding is independent, in which case an exponent of one still describes the occupancy of equivalent sites. Conversely, a fitted noninteger exponent describes average behavior and is not a fractional molecular structure. Do not infer the number of hemes from one steepness measurement.
Greater affinity is also not identical to greater delivery. If a carrier is highly occupied at both reservoir pressures, little oxygen is released. Compare the two endpoint occupancies and the available site capacity before ranking carriers. Finally, a saturation of fifty percent describes the occupied fraction across the sample. It does not require every individual four-site protein to carry exactly two oxygen molecules at every instant.
Identify the stated parameters.
$p=30\ \mathrm{kPa},\ P_{50}=10\ \mathrm{kPa},\ n=1$
These are invented equilibrium parameters.
Divide by the midpoint pressure.
$r=30/10=3$
The pressure unit cancels.
Apply the model exponent.
$r^n=3^1=3$
Independent sites use exponent one.
Normalize the occupied weight.
$Y=3/(1+3)=0.75$
The denominator includes empty and occupied weights.
Convert and check occupancy.
$100Y=75\%,\quad 100-75=25\%$
Occupied and empty percentages add to one hundred.
Set the pressure comparison.
$p=8\ \mathrm{kPa},\ P_{50}=16\ \mathrm{kPa},\ n=2$
The reservoir pressure is below the midpoint.
Normalize the reservoir pressure.
$r=8/16=0.5$
Use the same unit in numerator and denominator.
Square the full ratio.
$r^2=(0.5)^2=0.25$
The exponent applies after normalization.
Find the occupied fraction.
$Y=0.25/(1+0.25)=0.2$
Normalization converts a weight into a fraction.
Compare with independent sites.
$100Y=20\%,\quad 100(0.5/1.5)\approx33.33\%$
At this sub-midpoint pressure the cooperative model is less occupied.
State capacity and binding parameters.
$C=15\ \mathrm{mmol},\ P_{50}=10\ \mathrm{kPa},\ n=1$
Capacity counts all available sites.
Calculate the high-pressure fraction.
$Y_H=40/(10+40)=0.8$
The loading reservoir is at forty kilopascals.
Calculate the low-pressure fraction.
$Y_L=5/(10+5)=1/3$
The second reservoir still leaves some oxygen bound.
Subtract the two occupancies.
$Y_H-Y_L=4/5-1/3=7/15$
Only the change is released.
Multiply by the site capacity.
$15(7/15)=7\ \mathrm{mmol}$
One oxygen molecule occupies one site.
Check the oxygen inventory.
$15(0.8)=12,\quad15(1/3)=5,\quad12-5=7$
The bound amounts differ by the predicted release.
Normalize the given pressure.
$r=36/12=3$
Pressure units cancel.
Insert the independent-site exponent.
$Y=3/(1+3)$
Use n equal to one.
Convert occupancy into percent.
An invented carrier has half-saturation pressure $10$ kPa and Hill exponent $2$. At oxygen pressure $20$ kPa, use $Y=r^n/(1+r^n)$, where $r=p/P_{50}$. Enter occupied and unoccupied sites as percentages, to two decimal places.
| occupied (%) | unoccupied (%) | |
|---|---|---|
| carrier |
Complete this carrier calculation for $p=5$ kPa, $P_{50}=10$ kPa, and $n=2$. Use $Y=r^n/(1+r^n)$ and round the percentage to two decimal places.
Divide the two pressures.
$r=$ r
The ratio has no units.
Normalize the powered ratio.
$100Y=$ y
Divide the powered ratio by one plus itself, then multiply by one hundred.
Check the limiting values.
$0<Y<1$
Finite positive pressure leaves some sites occupied and some empty.
An invented carrier has half-saturation pressure $10$ kPa and Hill exponent $2$. At oxygen pressure $30$ kPa, use $Y=r^n/(1+r^n)$, where $r=p/P_{50}$. Enter occupied and unoccupied sites as percentages, to two decimal places.
| occupied (%) | unoccupied (%) | |
|---|---|---|
| carrier |
An invented carrier has half-saturation pressure $10$ kPa and Hill exponent $2$. At oxygen pressure $30$ kPa, use $Y=r^n/(1+r^n)$, where $r=p/P_{50}$. Enter occupied and unoccupied sites as percentages, to two decimal places.
| occupied (%) | unoccupied (%) | |
|---|---|---|
| carrier |
An invented carrier has half-saturation pressure $10$ kPa and Hill exponent $2$. At oxygen pressure $30$ kPa, use $Y=r^n/(1+r^n)$, where $r=p/P_{50}$. Enter occupied and unoccupied sites as percentages, to two decimal places.
| occupied (%) | unoccupied (%) | |
|---|---|---|
| carrier |
An invented carrier has half-saturation pressure $20$ kPa and Hill exponent $3$. At oxygen pressure $10$ kPa, use $Y=r^n/(1+r^n)$, where $r=p/P_{50}$. Enter occupied and unoccupied sites as percentages, to two decimal places.
| occupied (%) | unoccupied (%) | |
|---|---|---|
| carrier |
A California research lab compares invented oxygen carriers in a sealed apparatus. One sample has $26$ mmol of binding sites, $P_{50}=30$ kPa and $n=3$. It equilibrates first at $120$ kPa and then at $15.0$ kPa. With $Y=r^n/(1+r^n)$, enter the two saturation percentages and the mmol of bound oxygen released. Ignore dissolved oxygen. Round only final answers to two decimal places.
| loading (%) | unloading (%) | released (mmol) | |
|---|---|---|---|
| sample |
Lesson test: one question per skill, one attempt each, no hints. Your answers are checked when you submit.
An invented carrier has half-saturation pressure $10$ kPa and Hill exponent $1$. At oxygen pressure $5$ kPa, use $Y=r^n/(1+r^n)$, where $r=p/P_{50}$. Enter occupied and unoccupied sites as percentages, to two decimal places.
| occupied (%) | unoccupied (%) | |
|---|---|---|
| carrier |
Can you explain why the strongest-binding carrier need not deliver the most oxygen, and check a release calculation against its site capacity?
16. An independent-site carrier has $P_{50}=12$ kPa at $p=36$ kPa. Find the occupied percentage., step 3
$100(3/4)=75\%$
Percentage is one hundred times the fraction.