Back to the on-screen lesson ·
The rate at an instant as the gradient of a tangent, what the parts of a rate curve mean, and why height is not speed.
Paper packet. Every task here also exists on screen, where it is checked automatically; answers written on paper are not assessed by Nydus. When you are back at a device, enter your answers there.
By the end of this lesson you will be able to find the rate of a reaction at a stated time by drawing a tangent to a curve and dividing its rise by its run, find the initial rate from the tangent at time zero, and compare rates at two times. You will be able to say what the steep, bending and level parts of a curve mean, and why the curve that ends highest is not necessarily the faster reaction.
Last lesson a mean rate was a change divided by the interval it happened over, and the rate fell from one interval to the next as the reactants were used up. That leaves a problem: if the rate is changing all the time, a mean over ten seconds is not the rate at any particular second. A graph solves it.
A gradient is the steepness of a line: its rise (the change up the page) divided by its run (the change along it). A tangent is a straight line that touches a curve at one point and has the same direction as the curve there. The instantaneous rate is the rate at one moment, and the initial rate is the instantaneous rate at time zero.
Plot a quantity that changes during a reaction — gas volume, mass lost, a concentration — against time, and join the points with a smooth curve. Any two points on the curve give a mean rate over the interval between them: that is exactly last lesson's calculation, and on the graph it is the gradient of the straight line joining the two points.
Now slide the two points towards each other. The interval shrinks, the straight line between them turns into a line that just touches the curve, and its gradient becomes the rate at a single instant. That line is the tangent, and
$$\text{rate at time } t = \text{gradient of the tangent at } t = \frac{\text{rise}}{\text{run}}.$$
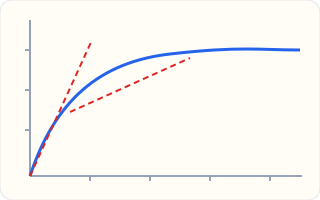
On a curve of gas collected against time the tangent is steepest at the start, where the reactants are most concentrated, gets shallower as the reaction goes on, and becomes flat when a reactant runs out. The initial rate is the gradient of the tangent at time zero, and it is the one rate that later lessons compare between experiments, because at time zero every experiment's starting conditions are exactly the ones that were set.
A rate is a change divided by the time it took. The height of a graph is how much has happened so far; the steepness is how fast it is happening now, and the two answer different questions.
Another way: picture
Walk up a hill that gets gentler towards the top. How high you are is your height on the map; how hard your legs are working is the slope under your feet. At the summit you are as high as you will ever be and the slope is zero. A volume–time curve is that hill: it is highest exactly where the reaction has stopped.
Another way: steps
To read a rate at a chosen time:
A curve of product against time for a typical reaction has three parts, and each says something different.
| Part of the curve | Gradient | What is happening |
|---|---|---|
| Steep start | largest | the reactants are at their most concentrated, so the rate is highest |
| Bend | falling | reactant is being used up, so every second gives less product than the one before |
| Level end | zero | one reactant has run out and the reaction has stopped |
The height of the level part is a different kind of information: it is the total amount of product, and it is fixed by the amount of the limiting reactant — a Chemistry 1 calculation. Two experiments with the same amount of limiting reactant level off at the same height however fast they went; one with twice the limiting reactant levels off twice as high even if it is slower.
A curve of a reactant against time is the mirror image: it starts high, falls steeply, and levels off at zero or at whatever was in excess. Its tangents have negative gradients, and the rate is quoted as their size.
Tangents are drawn by eye, so two careful people get slightly different gradients from the same curve. Three habits keep the error small.
Touch, do not cross. Near the point, the curve should lie on the same side of the line on both sides of the touching point. A line that cuts through the curve is a chord, and its gradient is a mean over an interval.
Read far apart. Take the two points for the rise and the run as far apart as the grid allows. A reading error of 1 mL is a 10% error on a rise of 10 mL and a 1% error on a rise of 100 mL.
Use the line, not the curve. Once the tangent is drawn, the curve has done its job. Reading the second point off the curve instead of off the line gives the chord again, and the chord is always shallower at the start of a reaction than the tangent.
Reading height as rate. The higher curve is the one with more product, not the one that made it faster. A curve is at its highest exactly where its rate has fallen to zero.
Reading the rate at a time as the reading divided by the time. A syringe that reads 60 mL at 30 s gives a mean rate of 2 mL/s over the first 30 s. The rate at 30 s is the tangent's gradient there, which is smaller, because the reaction has been slowing down.
Drawing a chord and calling it a tangent. A line from the origin to a later point on the curve is a chord: its gradient is the mean rate over that interval.
Deciding that a falling curve has a negative rate. The gradient of a reactant's curve is negative because the reactant is being used up. The rate is the size of that gradient: how fast, with the direction already said by the words used up.
A curve of oxygen collected from decomposing hydrogen peroxide levels off at 90 mL. The tangent at time zero passes through the origin and through 48 mL at 20 s.
The level value is a total and plays no part in a rate at time zero.
Rise $= 48 - 0 = 48$ mL; run $= 20 - 0 = 20$ s.
Both readings come off the tangent line, not off the curve.
Initial rate $= 48 \div 20 = 2.4$ mL/s.
The gradient of the tangent at time zero is the initial rate, in the unit of the quantity per second.
On the same curve, the tangent at 40 s passes through 60 mL at 20 s and 84 mL at 60 s.
The two points were chosen far apart along the tangent.
Rise $= 84 - 60 = 24$ mL over a run of $60 - 20 = 40$ s, so the rate at 40 s is $0.6$ mL/s.
Rise over run again, for this tangent on its own.
$2.4 \div 0.6 = 4$: the reaction was going four times as fast at the start as at 40 s.
Comparing two instantaneous rates shows how much the reaction has slowed.
Rise $= 50 - 20 = 30$ mL; run $= 60 - 10 = 50$ s.
Both points are on the tangent line.
Rate $= 30 \div 50 = \ldots$
…$0.6$ mL/s, the gradient of the tangent where it touches at 30 s.
A graph of the volume of carbon dioxide against time is drawn for marble chips reacting with hydrochloric acid. The tangent drawn at time zero starts at the origin and passes through $30$ mL at $30$ s. The curve itself levels off at $150$ mL at about $120$ s. What is the initial rate, in mL/s?
Answer: mL/s
The picture is a graph of the volume of gas collected against time for one reaction. Mark the part of the curve where the reaction has stopped because a reactant has run out.
This task has no paper form; do it on a device.
Two curves of gas volume against time are drawn for zinc granules reacting with sulfuric acid on the same axes. Curve X levels off at $80$ mL; its tangent at time zero has a gradient of $4$ mL/s. Curve Y levels off at $160$ mL; its tangent at time zero has a gradient of $2$ mL/s. Which reaction was faster at the start?
A graph of the volume of carbon dioxide against time is drawn for calcium carbonate powder reacting with nitric acid. Match each feature of the graph to what it tells you.
| the reaction is fast here | no more gas is forming: a reactant is used up | the total volume of gas the reaction gave | the rate at that one moment | |
|---|---|---|---|---|
| the curve is steep | ||||
| the curve has become level | ||||
| how high the level part sits | ||||
| the gradient of a tangent drawn at one time |
Three tangents are drawn on one volume–time curve, at 0 s, 20 s and 60 s. Each tangent is read at two times 20 s apart. Fill in the rise of each tangent and its gradient, in mL/s.
| first reading on the tangent, in mL | reading 20 s later on the tangent, in mL | rise, in mL | gradient, in mL/s | |
|---|---|---|---|---|
| tangent at 0 s | 0 | 40 | ||
| tangent at 20 s | 30 | 50 | ||
| tangent at 60 s | 55 | 60 |
You need the rate of a reaction at exactly $40$ s from a curve of product against time. Put the steps in order.
Number the steps in order (write the number in the box):
In a pharmaceutical stability test, the concentration of a drug in solution is plotted against time as it breaks down. The tangent drawn at the start meets the concentration axis at $0.4$ mol/L and the time axis at $500$ s. What is the initial rate at which the drug breaks down, in mol/(L s)?
Answer: mol/(L s)
Lesson test: one question per skill, one attempt each, no hints. Your answers are checked when you submit.
On a volume–time curve, the tangent at $10$ s passes through $(0, 25)$ and $(20, 125)$. The tangent at $50$ s passes through $(30, 400)$ and $(70, 450)$, with times in s and volumes in mL. Give both rates in mL/s, and how many times faster the reaction was at $10$ s than at $50$ s.
A rising curve of gas volume against time, with a tangent touching it at 10 s and another at 50 s.
Rate at 10 s, in mL/s:
Rate at 50 s, in mL/s:
How many times faster at 10 s:
You can read an instantaneous rate from a tangent and you keep height and steepness apart. Say out loud what the level part of a volume–time curve tells you, and what it does not. Next: why a reaction slows as its reactants are used up — the collision model.
10. Your turn: the tangent at 30 s on a volume–time curve passes through 20 mL at 10 s and 50 mL at 60 s. What is the rate at 30 s?, step 3