Back to the on-screen lesson ·
A titration curve as a record of what is in the flask: the equivalence volume, the $pK_a$ halfway there, and the shape each pair of partners makes.
Paper packet. Every task here also exists on screen, where it is checked automatically; answers written on paper are not assessed by Nydus. When you are back at a device, enter your answers there.
By the end of this lesson you will be able to locate the equivalence point on a titration curve and use its volume to find an amount, read the $pK_a$ of a weak acid at the half-equivalence point, plot a curve from pH readings, say what the flask contains at each stage, and tell from a curve's start and jump which kinds of acid and base were used.
Last lesson you calculated the volume at equivalence and the pH of the salt left there, and the pH of a mixture with one reagent in excess. A titration curve is those calculations done at every volume and joined up. You also know that a weak acid half converted to its conjugate base holds equal amounts of both — this lesson shows why that is worth finding.
A titration curve is a graph of pH against the volume of titrant added. The equivalence point is the middle of the steep rise, where the amounts have exactly matched. The half-equivalence point is at half the equivalence volume. The buffer region is the long, gentle stretch before equivalence in a weak-acid titration, where the flask holds both the acid and its conjugate base. The titrant is the solution in the burette; the analyte is the one in the flask.
Read a titration curve by asking, at each point, what the flask contains. For a weak acid titrated with sodium hydroxide:
At zero volume there is only the weak acid. It is slightly ionised, so the curve starts at about pH 3 for $0.1$ mol/L ethanoic acid, not at pH 1.
In the long gentle stretch each drop of hydroxide turns some acid into its conjugate base. The flask holds both, and a mixture of a weak acid and its conjugate base resists changes in pH: added hydroxide is taken up by the acid. That is why this stretch is so flat, and why it is called the buffer region.
Halfway to equivalence exactly half the acid has been converted, so $[\mathrm{HA}] = [\mathrm{A^-}]$. Put that into $K_a$:
$$K_a = \frac{[\mathrm{H_3O^+}][\mathrm{A^-}]}{[\mathrm{HA}]} = [\mathrm{H_3O^+}] \quad\Rightarrow\quad \mathrm{pH} = pK_a$$
The pH at the half-equivalence point is the acid's $pK_a$ — one of the few places a constant can be read straight off a graph.
At equivalence all the acid has gone and there is nothing left to take up hydroxide, so a single drop sends the pH up several units: the steep rise. Its middle is the equivalence point, and the flask then holds only the conjugate base, so for a weak acid the jump is centred above 7.
After equivalence hydroxide builds up and the pH creeps towards the pH of the alkali itself.
Another way: picture
Imagine a sponge soaking up water poured onto a table. While the sponge has room, the table stays dry — the gentle stretch. The moment the sponge is full, the next cupful floods the table — the steep rise. The volume poured when the flood begins tells you how big the sponge was, which is what the equivalence volume tells you about the acid.
Another way: steps
To read a titration curve:
The same reasoning gives the shape for every combination, each titrated at about $0.1$ mol/L:
| Flask + burette | Starts at | Middle of the jump | Size of jump |
|---|---|---|---|
| strong acid + strong base | about pH 1 | pH 7 | large, about 3 to 11 |
| weak acid + strong base | about pH 3 | about pH 8.7 | smaller, about 7 to 11 |
| strong acid + weak base | about pH 1 | about pH 5.3 | smaller, about 3 to 7 |
| weak acid + weak base | about pH 3 | near 7 | no sharp jump at all |
Flip the arrangement — base in the flask, acid in the burette — and each curve runs the other way: starting high and falling. The equivalence volume and the pH at equivalence are the same; only the direction changes.
The last row matters practically: with both partners weak, the pH changes gradually all the way through, and there is no sharp step for a colour change to catch. Such titrations are done with a pH probe or not at all.
The volume at equivalence gives the amount of acid, whatever its strength — the same reason a weak acid needs as much alkali as a strong one. The height of the curve at each stage tells you about strength: where it starts, how flat the buffer region is, and where the jump is centred.
The first point is not the equivalence point, and neither is the highest point: the curve keeps rising long after equivalence as excess alkali is added. Equivalence is found by steepness — the middle of the steepest part — which is the same lesson the rate graphs taught: read the gradient, not the height.
The first plotted point is the equivalence point. The first point is before any alkali. Equivalence is the middle of the steep rise.
The end of the curve is the equivalence point. The curve keeps rising as excess alkali is added. Equivalence is where it is steepest.
Every jump is centred on pH 7. Only strong with strong. A weak acid's jump is centred above 7 and a weak base's below.
The pH at equivalence equals the $pK_a$. That is at half the equivalence volume, where acid and conjugate base are equal.
A weaker acid needs less alkali, so its jump comes sooner. The jump's volume depends only on the amount of acid.
Ethanoic acid is titrated with $0.100$ mol/L sodium hydroxide. The steep rise is centred on $24.0$ mL, and at $12.0$ mL the pH is $4.76$.
Two readings: the jump, and halfway to it.
Equivalence at $24.0$ mL: $0.100 \times 0.0240 = 0.00240$ mol of hydroxide, so $0.00240$ mol of acid.
The volume gives the amount.
At $12.0$ mL, half the acid is converted, so $pK_a = 4.76$ and $K_a = 1.7 \times 10^{-5}$.
Halfway, the pH is the $pK_a$.
At $6.0$ mL the flask holds three parts ethanoic acid to one part ethanoate; at $18.0$ mL, one part to three.
Both are present all through the gentle stretch.
Each added hydroxide ion reacts with an acid molecule, $\mathrm{HA + OH^- \rightarrow A^- + H_2O}$, instead of staying in solution.
The acid takes up the base, so little hydroxide accumulates.
So the pH moves only from about 4.3 to about 5.2 across twelve millilitres — a buffer at work.
Until the acid runs out at equivalence.
$15.0$ mL is half of $30.0$ mL, so the $pK_a$ is $4.20$.
Halfway, acid and conjugate base are equal.
Twice the concentration in the same volume is twice the amount, so the jump would be at $\ldots$
…$60.0$ mL; the $pK_a$ would still be $4.20$, because it is a property of the acid.
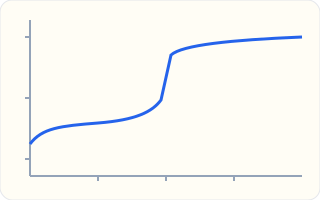
The picture is the pH curve for a weak acid titrated with sodium hydroxide solution. Mark the part of the curve where the alkali is in excess and the pH is set by the leftover hydroxide.
This task has no paper form; do it on a device.
methanoic acid is titrated with sodium hydroxide solution and the pH is logged. The pH reads $3.75$ at $14$ mL of alkali, rises slowly to about $4.75$ at $26$ mL, then leaps from about 7 to about 11 over the half-millilitre either side of $28$ mL. Give the equivalence volume and the $pK_a$ of the acid.
A weak acid titration curve: a gentle rise, a steep jump, then a level stretch.
Equivalence volume, in mL:
pKa of the acid:
$25$ mL of $0.1$ mol/L hydrochloric acid is titrated with $0.1$ mol/L sodium hydroxide. The pH readings, rounded to whole numbers, are: $0$ mL pH $1$; $10$ mL pH $1$; $20$ mL pH $2$; $24$ mL pH $3$; $25$ mL pH $7$; $26$ mL pH $11$; $30$ mL pH $12$; $40$ mL pH $12$. Plot the readings, volume across and pH up.
Plot your answer on the grid:
A titration curve starts at pH 3, rises gently until about $15$ mL, then jumps from about pH 7 to pH 11 around $17$ mL; the middle of the jump is at about pH 8.7. Which titration produced it?
A weak acid is titrated with sodium hydroxide solution. Match each feature of the curve to what it tells you.
| how strong and how concentrated the acid is | how many moles of acid were in the flask | the acid's pKa | whether the salt formed is acidic, neutral or basic | roughly the pH of the alkali itself | |
|---|---|---|---|---|---|
| the pH before any alkali is added | |||||
| the volume at the middle of the steep rise | |||||
| the pH at half that volume | |||||
| the pH at the middle of the steep rise | |||||
| the pH the curve levels off at |
ethanoic acid is titrated with sodium hydroxide solution. Say what the flask mainly contains, apart from water and sodium ions, at each stage.
| main contents | |
|---|---|
| before any alkali is added | |
| halfway to the equivalence point | |
| at the equivalence point | |
| well past the equivalence point |
A dairy checks how sour a batch of milk has become by titrating $20$ mL of whey with $0.100$ mol/L sodium hydroxide while logging the pH. The curve's steep rise is centred on $11.0$ mL. Lactic acid gives one proton per molecule. What is the concentration of lactic acid in the whey, in mol/L?
Answer: mol/L
Lesson test: one question per skill, one attempt each, no hints. Your answers are checked when you submit.
$17$ mL of ammonia solution is in the flask and hydrochloric acid of the same concentration is added from the burette while the pH is logged. Which description fits the curve?
You can read a titration curve for amounts, for strength and for $pK_a$. Say out loud why the pH halfway to equivalence equals the $pK_a$. Next: the flat stretch of the curve as a solution in its own right — buffers.
10. Your turn: a curve for benzoic acid has its steep rise centred on $30.0$ mL. At $15.0$ mL the pH is $4.20$. What is the $pK_a$, and where would the jump be if the acid were twice as concentrated?, step 3