Back to the on-screen lesson ·
Reconcile capital accumulation and distinguish total growth from productivity and capacity changes.
Paper packet. Every task here also exists on screen, where it is checked automatically; answers written on paper are not assessed by Nydus. When you are back at a device, enter your answers there.
Construct capital-stock and productivity tables, plot supplied production points, identify diminishing marginal returns under fixed conditions, and distinguish capital deepening, utilization, and durable capacity growth.
A demand expansion can move actual output toward existing potential. Long-run growth instead concerns the capacity to produce goods and services over time. Capital accumulation, labor inputs, human capital, technology, and institutions can matter through distinct mechanisms. Measure output per person or per worker when that is the question, and distinguish a capital stock from the investment flow that changes it.
| Term | What it means |
|---|---|
| Labor productivity | Real output per unit of labor input, such as per worker or per hour. |
| Physical capital | Produced assets used in production over time, rather than money balances or financial claims. |
| Depreciation | Loss of productive capital value or capacity through wear, obsolescence, or other specified causes. |
| Capital deepening | An increase in physical capital per worker or per unit of labor input. |
| Diminishing marginal returns | A decline in additional output from an extra unit of one input while other relevant inputs and technology are fixed. |
| Human capital | Productive knowledge and skills embodied in people. |
An increase in total real GDP does not necessarily increase real GDP per person. If output and population grow at the same proportional rate, output per person is unchanged. Labor productivity uses a different denominator: workers or hours. Output per person also depends on how much of the population works and how many hours workers supply. These ratios answer related but distinct questions.
Potential output can rise when the economy has more productive inputs or uses them more effectively. In an aggregate-supply representation, a durable increase in productive capacity shifts long-run aggregate supply to the right. In a production-possibility representation it can expand the feasible set. A movement from idle capacity toward an unchanged frontier is recovery or improved utilization, not necessarily an expansion of the frontier itself.
Growth also has a time dimension. A one-time rise in output's level can improve production without permanently raising its growth rate. A faster growth rate compounds into an increasing proportional difference if sustained. Describing a policy as promoting growth should therefore specify whether the claim concerns a temporary transition, a permanent level effect, or an enduring growth-rate change, and identify the mechanism supporting it.
Another way: steps
Choose total, per-person, per-worker, or per-hour output according to the question. Reconcile capital accumulation using investment minus depreciation. Hold other inputs fixed when interpreting diminishing returns. Separate movement toward current capacity from expansion of capacity, and state the assumptions behind any sustained-growth claim.
A simple capital accounting rule is next period's stock equals the current stock plus gross investment minus depreciation. If a fictional economy begins with one thousand machines of equivalent productive capacity, installs 150 during the year, and loses one hundred through the specified depreciation measure, its ending stock is 1,050. Gross investment is 150, net investment is fifty, and capital growth is five percent.
Depreciation in this exercise is expressed in the same capital units as investment and the opening stock. In monetary national accounts, consistent prices and valuation matter. Buying an existing asset from another domestic owner generally transfers ownership rather than creating additional aggregate productive capital. Financial investment in a bond is also not identical to installing a machine, even though financing can support a later physical investment project.
If the workforce also rises by five percent, the five-percent capital-stock increase leaves capital per worker unchanged. If workers increase from one hundred to 105 while capital rises from one thousand to 1,050, both periods have ten capital units per worker. Calling this capital deepening would be incorrect. Total capital increased, but capital relative to labor did not.
Replacement investment prevents depreciation from shrinking the stock. Gross investment can be positive while net investment is negative if depreciation is larger. For example, investment of sixty with depreciation of eighty reduces the stock by twenty. A report that cites positive investment without comparing depreciation cannot establish that the productive capital stock grew. The accounting identity provides a useful first check before any behavioral growth argument.
The timing convention also matters. Some exercises compute depreciation as a fraction of opening capital, while others use a different convention. If depreciation is ten percent of an opening stock of one thousand, it is one hundred under that rule. Do not silently apply the rate to the ending stock or to investment as well. State the convention, compute each flow, and then reconcile the stock.
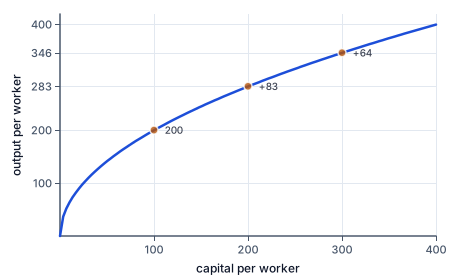
The figure shows diminishing returns: equal additions of capital add smaller and smaller amounts of output.
Consider a fictional production table with one hundred workers and unchanged technology. Capital of one hundred produces real output of two hundred; capital of two hundred produces 280; capital of three hundred produces 340. Each additional hundred capital units adds output, but the increments decline from eighty to sixty. This is diminishing marginal returns to capital over the supplied intervals, holding labor and technology fixed.
Diminishing returns do not mean that more capital reduces total output. In this table output continues to rise; it rises by smaller increments for equal additions of capital. Nor does the table prove that every technology or range has that property. It is a stipulated production relationship. A correct description names the changing input, the fixed inputs, and the interval over which the marginal comparison is made.
If technology improves, the entire relationship between capital and output can shift upward. Output at the same capital and labor can then be higher. Combining a capital increase with a technology improvement is different from moving along one unchanged production relationship. A graph showing only the final point cannot separate those contributions without additional information or a stated model.
Human capital can raise workers' capacity to use equipment, solve problems, and adapt production. Education and training are possible channels, but spending on them does not automatically yield the same productive outcome in every setting. Quality, access, relevance, health, complementary inputs, and institutional conditions affect the result. An assessed numerical case should state the assumed productivity effect instead of presenting a universal return to education.
A simple growth model with diminishing returns can predict that a higher saving rate increases the long-run level of capital and output per worker while the transition temporarily raises growth. Sustained per-worker growth may then require technological progress or another mechanism that prevents the same diminishing-return constraint from ending the acceleration. The lesson's tables illustrate the distinction without claiming that one simple model captures all historical development paths.
Technology includes knowledge about how to combine inputs and organize production, not only new electronic devices. A process improvement that reduces waste can raise output from the same measured resources. Research, learning, adoption, and diffusion can contribute, but the size and timing of their effects depend on the setting. A model that supplies a productivity factor isolates an effect; it does not establish how easily the factor can be increased in practice.
Infrastructure can complement private production by lowering transport, communication, energy, or coordination costs. Whether a particular project raises productive capacity depends on use, maintenance, execution, and opportunity cost. Financing it can also affect other investment or future taxes. A complete comparison distinguishes the project's productive channel from its financing and resource-allocation effects rather than assuming that every public expenditure is either pure consumption or guaranteed growth.
Institutions influence incentives, predictability, exchange, and the ability to use knowledge and resources. Examples include how contracts are enforced, how entry and competition operate, and how people obtain education or participate in markets. These are broad mechanisms, not a deterministic ranking of societies. Historical context and evidence are required to evaluate a specific institutional change, and multiple institutions can interact.
Trade can permit specialization, a larger market, access to inputs, and learning. Those channels can affect productivity, but gains and adjustment costs need not be evenly distributed. A static comparative-advantage gain in consumption opportunities is not identical to a permanent increase in the economy's growth rate. Explain which claim is being made and which additional assumptions support a dynamic productivity effect.
Environmental depletion and unpriced damage can make measured output growth an incomplete description of changes in productive assets or welfare. A higher GDP figure does not by itself show that all relevant capital, health, or environmental conditions improved. Distribution, leisure, unpaid work, and security also matter to broader assessments. The growth calculations here measure declared production ratios rather than offering a complete welfare index.
Evidence about growth mechanisms often faces reverse causation and omitted variables. Richer economies may spend more on education and infrastructure, while those investments may also help production. An observed association cannot settle the causal direction by itself. A careful argument identifies the proposed mechanism, plausible alternatives, the relevant comparison, and uncertainty. The deterministic exercises deliberately supply the quantities needed for a transparent model conclusion.
Suppose real output rises from one thousand to 1,200 units while population rises from one hundred to 110 people. Output per person rises from ten to 120 divided by eleven units. Its exact growth factor is the total-output factor 1.20 divided by the population factor 1.10. The resulting growth rate is approximately 9.09 percent, not exactly ten percent. Subtracting the two growth rates is a useful approximation only when its use is identified.
For a terminating exact example, let output rise by fifty percent and population by twenty percent. The per-person factor is 1.50 divided by 1.20, or 1.25, so real output per person rises twenty-five percent. This factor method also works for capital per worker and output per hour. Choose the appropriate denominator and maintain consistent measurement periods before doing the arithmetic.
If workers put in more hours, output per worker can rise even with unchanged output per hour. If employment becomes more widespread, output per person can rise even with unchanged worker productivity. These changes can matter for living conditions, but they represent different margins. Reporting the relevant ratios separately makes the explanation more precise and avoids attributing every increase to a technological improvement.
A fictional planning office records an opening stock of one thousand equivalent machine units and one hundred workers. During the year, gross investment adds 150 machine units and depreciation removes one hundred. The next period therefore begins with 1,050 machine units. The workforce has also grown to 105 workers.
The office's draft report claims that the five-percent rise in the capital stock proves workers now have more capital each. Dividing by the workforce corrects the claim: the initial ratio was ten machines per worker, and the final ratio remains ten. Capital accumulation has kept pace with workforce growth, but the supplied data do not show capital deepening. A productivity gain might still arise from technology or skills, but neither is established by these two stock and workforce figures alone.
A second plan adds two hundred machine units with the same depreciation and workforce change. Ending capital would be 1,100, or 220 divided by twenty-one units per worker. This ratio is higher than ten, so that alternative does create capital deepening. Its output effect would require the production relationship; it cannot be read directly as the same percentage increase in output because diminishing returns or other conditions may matter.
The report should separate gross investment, depreciation, net investment, capital growth, and capital per worker. It should then identify any independently supported change in technology or human capital before explaining productivity. This sequence produces a more defensible comparison than treating every investment expenditure as an equal increase in living standards.
Capital growth can merely keep pace with labor growth. Positive gross investment can coexist with negative net investment. Diminishing marginal returns mean smaller positive increments under fixed conditions, not necessarily falling total output. A demand-led recovery uses existing capacity, while durable productivity or input changes can expand capacity. Output growth is not a complete welfare measure.
Record the opening productive stock.
Opening capital=1,000 machine units.
The stock is measured at the start of the stated interval.
Record gross additions during the interval.
Gross investment=150 machine units.
These additions are flows rather than the ending stock.
Subtract the stated depreciation flow.
Net investment=150-100=50 machine units.
Replacement needs reduce the increase in productive capital.
Calculate the ending stock.
Ending capital=1,000+50=1,050 machine units.
The stock changes by net rather than gross investment.
Calculate the capital growth rate.
50/1,000×100=5%.
The opening stock is the denominator for its proportional change.
Hold the other productive conditions fixed.
Labor is one hundred workers and technology is unchanged.
Marginal comparisons require a common background of other inputs.
Record equal increments of capital.
Capital rises100→200→300 units.
Equal input intervals make the output increments comparable.
Compute the first additional output.
280-200=80 real output units.
This is the gain from the first additional hundred capital units.
Compute the second additional output.
340-280=60 real output units.
The second equal input increase produces a smaller output gain.
State the correct interpretation.
Output rises, but its added amount falls80→60.
Diminishing marginal returns are compatible with increasing total output.
Calculate initial capital per worker.
1,000/100=10 machine units per worker.
The ratio is the relevant measure for capital deepening.
Reconcile the next capital stock.
1,000+150-100=1,050 machine units.
Investment and depreciation determine the stock available later.
Record the later workforce.
Workers increase100→105.
Capital must be compared with the denominator from the same date.
Calculate later capital per worker.
1,050/105=10 machine units per worker.
The stock increase exactly matches workforce growth.
Compare the ratios directly.
Capital per worker changes byzero percent.
A larger total capital stock does not establish capital deepening.
Limit the productivity inference.
Technology or skills could change productivity, but these figures do not establish either.
A production explanation requires information beyond the capital and workforce totals.
Convert total-output growth into a factor.
Fifty-percent output growth gives factor1.50.
A gross factor includes the initial output level.
Divide by the population growth factor.
Twenty-percent population growth gives1.50/1.20=1.25.
Per-person output uses population in its denominator.
Convert the ratio factor into its growth rate.
A fictional economy starts with800 equivalent machine units. Gross investment adds120 units, and depreciation removes80 units during the year. Compute net investment, ending capital, and capital growth percent.
| Value | |
|---|---|
| Net investment machine units | |
| Ending capital machine units | |
| Capital growth percent |
A fictional capital stock begins at600 units. Gross investment adds120 and depreciation removes60. The workforce rises from sixty to sixty-six workers. Complete ending capital, ending capital per worker, and percent growth in capital per worker.
Reconcile the capital stock after both flows.
Ending capital=stock units.
Net rather than gross investment changes the opening productive stock.
Divide by the workforce at the ending date.
Ending capital per worker=ratio units.
The stock and workforce must refer to the same date.
Compare with the opening capital-per-worker ratio.
Capital-per-worker growth=growth percent.
Equal proportional growth of numerator and denominator leaves their ratio unchanged.
With labor and technology fixed, a fictional production table gives capital100→output200, capital200→output280, and capital300→output340. Plot the three supplied points with capital units horizontal and real output units vertical.
Plot your answer on the grid:
A fictional economy's real output rises from1,000 to1,500 units while population rises from100 to120 people. Compute initial and final output per person and exact growth of output per person.
| Value | |
|---|---|
| Initial units per person | |
| Final units per person | |
| Per-person growth percent |
Construct the supplied capacity argument. A stipulated process improvement reduces waste with the same capital and labor. It increases feasible real output at those inputs, raises potential output, and shifts the model's LRAS right. The case does not describe a change in demand or only fuller use of idle equipment.
This task has no paper form; do it on a device.
A fictional workshop produces800 real units using100 worker-hours in periodA. In periodB it produces960 units using120 worker-hours, with the same workforce size of ten people. Compute output per hour and output per worker in each period.
| Output units per hour | Output units per worker | |
|---|---|---|
| A | ||
| B |
Lesson test: one question per skill, one attempt each, no hints. Your answers are checked when you submit.
A fictional economy starts with1,000 capital units and100 workers. Gross investment is200 units and depreciation100 units. Next period has110 workers. Real output rises from2,000 to2,420 units. Compute ending capital, ending capital per worker, final output per worker, and exact growth in output per worker.
| Value | |
|---|---|
| Ending capital units | |
| Ending capital units per worker | |
| Final output units per worker | |
| Output-per-worker growth percent |
You can measure growth with the correct denominator and identify the mechanism needed for a productive-capacity claim. Next, distinguish the public deficit flow from the debt stock and compare their financing conditions.
14. Compute exact per-person growth, step 3
(1.25-1)×100=25%.
Subtracting growth percentages directly would only be an approximation.