Back to the on-screen lesson ·
Construct labor-market rates and distinguish measured stocks from the flows and causes behind them.
Paper packet. Every task here also exists on screen, where it is checked automatically; answers written on paper are not assessed by Nydus. When you are back at a device, enter your answers there.
Compute unemployment, participation, and employment-population ratios from stated classifications; reconcile status transitions; and distinguish search, structural, and cyclical mechanisms without interpreting a rate as a complete welfare measure.
A price index and a real-output measure differ partly because their reference groups differ. Labor-market measures have the same issue. A rate can change because its numerator changes, because its denominator changes, or both. Our fictional surveys supply an explicit classification rule and population rather than claiming to reproduce every jurisdiction's detailed statistical definition.
| Term | What it means |
|---|---|
| Employed | People performing qualifying paid or self-employed work, or meeting the scenario's stated job-attachment rule. |
| Unemployed | People without employment who meet the stated availability and search criteria or a specified temporary-layoff exception. |
| Labor force | The employed and unemployed groups combined. |
| Participation rate | Labor force divided by the specified working-age population. |
| Employment-population ratio | Employed people divided by the specified working-age population. |
| Discouraged worker | A person wanting work who stops active search for stated labor-market reasons and falls outside the headline labor force under the rule used here. |
A fictional survey covers two hundred working-age residents. It classifies 120 as employed, thirty as without employment but available and actively searching, and fifty as outside the labor force. Those fifty include students, retired people, caregivers, and others who do not meet the unemployment criteria. The labor force is 120 + 30 = 150. The unemployment rate is thirty divided by 150, or twenty percent.
The participation rate is 150 divided by two hundred, or 75 percent. The employment-population ratio is 120 divided by two hundred, or sixty percent. These three rates describe the same people but answer different questions. Using thirty divided by two hundred would give the unemployed share of the whole specified population, fifteen percent, which is not the headline unemployment rate defined here.
For each rate, also check the implied counts. A twenty-percent unemployment rate with a labor force of 150 implies thirty unemployed people. If a proposed answer instead implies forty, it cannot describe this table. This reverse check can reveal a misplaced denominator even when the reported percentage looks plausible. Never round an intermediate population count to force a preferred headline rate; preserve the supplied categories and round only the final reported rate when requested.
Classifying someone outside the labor force does not imply they make no useful contribution, do not want work, or should be working. It is a statistical category defined for a specific measure. Likewise, employed can include someone working fewer paid hours than they want. The headline rate is informative within its scope, but it cannot summarize every form of labor underutilization or welfare.
Another way: steps
Classify each person under the stated rules. Add employed and unemployed to obtain the labor force. Choose the denominator required by each named rate. When someone changes status, update every affected group before recalculating.
The United States Bureau of Labor Statistics ordinarily classifies someone without a job as unemployed when they are available for work and actively sought work during the prior four weeks. Its Current Population Survey also includes qualifying people on temporary layoff who expect recall, even when they did not actively search. This exception differs from a discouraged person who wants work but stopped searching and does not meet the temporary-layoff conditions. The latter is outside the headline labor force under these rules. Our classification exercise states that the temporary-layoff group qualifies for recall and availability, so it belongs with the unemployed. Other fictional examples explicitly identify their groups and do not silently override the official exception. A real statistical comparison must check the applicable survey definition rather than treating active search as an exceptionless rule everywhere.
Suppose ten of the thirty unemployed residents stop actively searching while remaining without employment. Under the stated rule they move outside the labor force. Employed remains 120, unemployed falls to twenty, and the labor force falls to 140. The unemployment rate becomes twenty divided by 140, approximately 14.29 percent. It falls even though no additional person obtained employment.
The employment-population ratio remains sixty percent because employment and the specified population are unchanged. Participation falls to seventy percent because fewer people meet the labor-force definition. Reading the three measures together reveals the mechanism that the unemployment rate alone leaves ambiguous. A decline in unemployment is not automatically evidence of job creation, just as an increase is not automatically evidence that employers eliminated jobs.
Consider a different transition: ten previously inactive residents begin active search and are available, but none yet finds work. Employment remains 120, unemployment rises from thirty to forty, and the labor force rises from 150 to 160. The unemployment rate rises to 25 percent while participation rises to eighty percent. The survey records entry into job search rather than a reduction in the employed count.
If ten unemployed residents instead obtain jobs, employment rises to 130 and unemployment falls to twenty, while the labor force stays at 150. The unemployment rate falls to approximately 13.33 percent and the employment-population ratio rises to 65 percent. The same broad direction in the unemployment rate can therefore arise through a materially different transition. Write the category changes before interpreting the percentages.
Migration, aging into or out of the measured population, institutional changes, and survey revisions can also affect denominators. Our exercises hold the working-age population fixed unless explicitly stated otherwise. A real report requires checking its population definition and time basis. Comparing rates built from different age ranges or seasonal adjustments can create an apparent difference that is partly a measurement difference.
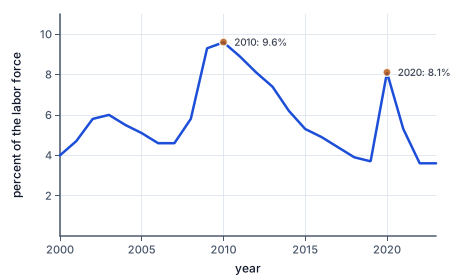
The figure shows the U.S. rate since 2000: the jumps after 2008 and in 2020 are cyclical, on top of frictional and structural unemployment that never goes away.
Frictional unemployment arises while people search for or move between suitable jobs. Matching takes time because workers and employers have incomplete information, preferences differ, and offers arrive at different dates. A person who leaves one job and searches for a better match can be unemployed under the statistical rule even in an economy with many vacancies. Calling the spell frictional describes a search mechanism, not a judgment that the person is at fault or needs no support.
Structural unemployment concerns persistent mismatches between available workers and jobs, such as location, skills, credentials, or changes in the composition of demand. Suppose a declining fictional industry releases machine operators while expanding firms require different training in another region. The existence of vacancies does not instantly resolve that mismatch. Retraining, relocation, wage adjustment, and job design may matter, but their effectiveness and costs require evidence beyond the label.
Cyclical unemployment is associated with short-run fluctuations in aggregate economic activity relative to potential. A broad fall in spending can reduce firms' desired production and labor demand, creating joblessness across multiple industries. In a simple aggregate model, closing a recessionary output gap reduces this cyclical component. The model does not imply that all unemployment disappears when output reaches potential, because search and structural mismatches can remain.
The natural rate is a model concept describing unemployment consistent with the economy's longer-run labor-market structure, often associated with frictional and structural unemployment in introductory analysis. It is not directly observed as a permanently fixed number. Institutions, demographics, matching efficiency, and shocks can change it, and estimates are uncertain. Full employment in this sense does not mean every adult has a paid job or the unemployment rate is zero.
A particular observed spell can involve several mechanisms. A worker displaced during a recession may also need new skills, and weak demand can prolong a normal search. The categories organize explanations; they are not always mutually exclusive labels that a short anecdote can conclusively establish. Graded cases state the relevant causal conditions explicitly so the inference is bounded. An actual diagnosis would require more information than a one-sentence story.
Employment and unemployment counts are stocks measured for a reference period or date under the survey rules. Hires, separations, and movements into or out of the labor force are flows between observations. An unchanged employed total can conceal many hires and departures. If twenty people leave jobs and twenty different people enter employment, the stock is unchanged while the labor-market turnover is substantial.
Net employment change is therefore not the same as the number of jobs or employment relationships created during an interval. A stock-flow reconciliation starts with the previous count, adds entrants, and subtracts exits. Check whether a dataset counts people, jobs, or hours: a person with two jobs can contribute differently to establishment job counts and household employment counts. Our examples count people unless they explicitly state another unit.
Hours matter too. Someone employed for a few hours may want full-time work, while another may prefer a short schedule. The headline employment count treats both as employed under the stipulated qualifying-work rule. A broader underutilization assessment might examine involuntary part-time work, discouraged searchers, and other marginally attached people, but the exact definitions need to be stated. Adding categories without defining their overlap risks counting the same person twice.
Comparisons across groups require denominator discipline. A group with a higher unemployment count can have a lower unemployment rate if its labor force is much larger. A falling participation rate may reflect discouragement, retirement, education, caregiving, or other changes; the rate alone does not identify which explanation dominates. Link a causal claim to observed transitions or suitable supporting evidence rather than reading motives directly from an aggregate percentage.
The measures also differ from welfare evaluations. More paid employment can raise income and production while changing leisure, unpaid care, or working conditions. A person leaving paid work voluntarily and a person unable to find suitable work may enter the same broad nonparticipation category. That is a reason to supplement the measure when the question demands it, not to discard the arithmetic. A useful report states the measured outcome, identifies its limitations, and asks for the additional evidence relevant to the proposed conclusion.
The district of Elm reports that its unemployment rate fell from twenty percent to ten percent in one quarter. Its population remains two hundred working-age residents. Initially, 120 are employed, thirty are unemployed under the available-and-searching rule, and fifty are outside the labor force. At the end, 126 are employed, fourteen are unemployed, and sixty are outside the labor force. All figures refer to the same population and classification rules.
The initial labor force is 150 and the final labor force is 140. The initial unemployment rate is 30/150 = twenty percent; the final rate is 14/140 = ten percent. Employment increased by six people, so the employment-population ratio rose from sixty to 63 percent. Participation fell from 75 to seventy percent. The decline in unemployment therefore accompanies both employment growth and lower participation.
The announcement claims that sixteen unemployed people found jobs because unemployment fell by sixteen. The stock totals alone do not establish that transition. Some people may have stopped searching, some may have entered employment from outside the labor force, and other offsetting movements may have occurred. The six-person employment increase and ten-person participation decline are net changes, not a complete record of individual flows.
A corrected statement can report all three rates and the category totals. To establish how many unemployed residents found jobs, request matched transition data or another suitable flow measure. The case demonstrates a recurring distinction in macroeconomics: an accounting reconciliation can be exact while a causal or personal-history explanation remains underdetermined.
Not working does not automatically mean statistically unemployed. A lower unemployment rate can result from labor-force exit without job growth. Full employment does not imply zero unemployment. Natural unemployment is a model concept with uncertain estimates, not a permanent observed constant. Net changes in stocks do not identify every gross transition.
Record mutually exclusive status counts.
120 employed, thirty unemployed, fifty outside the labor force.
These categories exhaust the two hundred residents in the stated survey.
Construct the labor-force denominator.
120 + 30 = 150.
Unemployment is measured relative to employed plus unemployed people.
Calculate the unemployment rate.
30/150 × 100 = 20%.
The whole working-age population is not this rate's denominator.
Calculate the participation rate.
150/200 × 100 = 75%.
Participation asks which share of the specified population is in the labor force.
Calculate the employment-population ratio.
120/200 × 100 = 60%.
This separate measure relates employed people to the full reference population.
Start from the original status counts.
120 employed, thirty unemployed, fifty outside.
The initial labor force is 150.
Apply the specified transition.
Ten outside residents begin active search and are available.
Under the scenario's rule, these people enter unemployment rather than employment.
Update the category counts.
120 employed, forty unemployed, forty outside.
Employment is unchanged while participation increases.
Recalculate labor force and unemployment.
Labor force 160; 40/160 = 25% unemployment.
The numerator and denominator both increase.
Interpret the observed change narrowly.
Participation rises to 80%; no employment decline is specified.
A higher unemployment rate here reflects search entry rather than layoffs.
Compute the starting labor force.
120 + 30 = 150 residents.
The initial unemployment rate is thirty divided by this count.
Compute the ending labor force.
126 + 14 = 140 residents.
The ten-person decline in participation changes the rate's denominator.
Verify both unemployment rates.
30/150 = 20%; 14/140 = 10%.
The advertised percentage change is arithmetically correct.
Check employment and participation separately.
Employment ratio 60% to 63%; participation 75% to 70%.
The unemployment decline combines different movements in the measured stocks.
Identify the unsupported transition claim.
Unemployment fell sixteen, but employment rose only six net.
The totals do not show how each person moved between categories.
Request evidence matching the claim.
Use individual transition counts to identify unemployed-to-employed moves.
A gross-flow claim requires information beyond two snapshots of stocks.
Record the classifications.
Eighty employed, twenty unemployed, one hundred outside; population two hundred.
The unemployment group explicitly meets the availability and search rule.
Construct the labor force and its unemployment share.
Labor force one hundred; unemployment 20%.
Only employed and unemployed people enter this denominator.
Construct participation and employment ratios.
A fictional survey uses the stated United States BLS classification: 180 residents are employed; fifteen lack jobs, are available, and actively searched in the prior four weeks; five are available on qualifying temporary layoff awaiting recall without searching; ten are discouraged nonsearchers who do not qualify for recall; and forty other residents are outside the labor force. Include the qualifying temporary-layoff group as unemployed, and exclude discouraged nonsearchers from the labor force. Calculate the labor force and the three stated rates for this population.
| Value | |
|---|---|
| Labor force people | |
| Unemployment percent | |
| Participation percent | |
| Employment-population percent |
A fictional population has ninety-six employed people, twenty-four available active searchers without employment, and eighty people outside the labor force. Complete the rates.
Add employed and unemployed residents.
Labor force = labor people.
The two categories together define the unemployment denominator.
Divide unemployed residents by the labor force.
Unemployment rate = unemployment percent.
People outside the labor force are excluded from this denominator.
Divide the labor force by the full population.
Participation rate = participation percent.
The full population includes all three mutually exclusive categories.
A fictional population has eighty employed, twenty unemployed, and one hundred outside the labor force. Twenty-five outside residents become available active searchers but do not find employment. Population is unchanged. Complete the new counts.
| People | |
|---|---|
| Employed | |
| Unemployed | |
| Outside labor force | |
| Labor force |
Construct the explanation of a falling unemployment rate when some unemployed people stop searching, no one gains employment, and the population stays fixed.
This task has no paper form; do it on a device.
A fictional region starts with 300 employed people. During the month, forty previously nonemployed people enter employment and thirty employed people leave it. No other employment transitions occur. Compute ending employment, gross entries, and net employment change.
| People | |
|---|---|
| Ending employed | |
| Gross entries | |
| Net employment change |
A fictional district's working-age population is four hundred: two hundred employed, fifty unemployed under its search rule, and 150 outside the labor force. Fifty employed residents voluntarily stop work and do not search while attending training. Complete the new employed count, labor force, and participation percent.
| Value | |
|---|---|
| Employed people | |
| Labor force people | |
| Participation percent |
Lesson test: one question per skill, one attempt each, no hints. Your answers are checked when you submit.
A fictional survey initially has 240 employed, sixty unemployed, and two hundred outside its labor force. Twenty unemployed residents obtain jobs; forty other unemployed residents stop search and move outside. No one else changes status and the population stays fixed. Compute final employment, unemployment, labor force, participation percent, and employment-population percent.
| Value | |
|---|---|
| Employed people | |
| Unemployed people | |
| Labor force people | |
| Participation percent | |
| Employment-population percent |
You can explain why unemployment can fall without employment rising and why stock totals do not reveal every personal transition. Next, relate aggregate activity to potential output without treating potential as directly observed.
14. A small fixed-population survey, step 3
Participation 50%; employment-population ratio 40%.
Both of these measures use the full two-hundred-person population.