Back to the on-screen lesson ·
Build a fixed-basket index and distinguish price levels, inflation rates, and purchasing-power returns.
Paper packet. Every task here also exists on screen, where it is checked automatically; answers written on paper are not assessed by Nydus. When you are back at a device, enter your answers there.
Construct fixed-basket price indexes, distinguish inflation from disinflation and deflation, and calculate exact real returns while separating expected from realized price changes.
The preceding lesson held prices fixed to compare production quantities. This lesson holds a fictional consumption basket fixed to compare its cost at different prices. Keep that change in purpose visible: a price index and a real-output measure can use the same price table while asking different questions.
| Term | What it means |
|---|---|
| Consumer price index | A measure of the changing cost of a specified consumption basket or related consumer-price methodology. |
| Inflation | A proportional increase in a broad price index over a stated interval. |
| Disinflation | A decline in the inflation rate while the price level may still rise. |
| Deflation | A fall in a broad price level over the stated interval. |
| Real interest rate | The purchasing-power return after accounting for inflation under a stated timing convention. |
| Expected and realized inflation | The price change anticipated before a decision versus the price change observed afterwards. |
Consider a fictional monthly basket containing ten meals and five bus trips. In the reference month, a meal costs four dollars and a trip costs two dollars, so the basket costs fifty dollars. In a later month, meals cost five dollars and trips cost three dollars. The same basket now costs 65 dollars. Its fixed-basket price index is 65 divided by fifty, multiplied by one hundred, or 130.
The index means this unchanged basket costs thirty percent more than in the reference period. It does not mean the household actually purchased the same basket or that every price rose thirty percent. Meal prices rose 25 percent, while trip prices rose fifty percent. The basket's expenditure weights determine how those different changes combine. An unweighted average of the two percentage changes would give 37.5 percent, not the basket's actual thirty-percent increase.
The fixed quantities are essential to this exercise. If a household buys fewer trips after their price rises, its actual spending could rise by less, stay constant, or fall. That spending change mixes prices and quantities, so it is not the same measure as the cost of the unchanged basket. A price index supplies a controlled comparison; describing the household's behavior requires additional information.
Another way: steps
Multiply each fixed basket quantity by each period's price. Add to find basket costs. Divide the later cost by the reference cost to form the index. For inflation between two dates, divide the change in index by the earlier index.
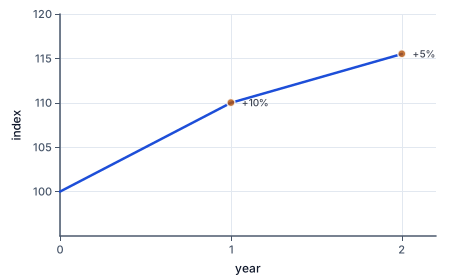
The figure plots this index: the line keeps rising while its rise slows, which is disinflation.
A reference index of one hundred sets a scale, not a natural price level. The index can be rebased by multiplying every period's value by the same constant. That changes displayed index levels but preserves proportional changes between periods. If a basket costs fifty dollars in the reference month and 65 later, using a reference scale of two hundred would produce a later index of 260, with the same thirty-percent increase.
Suppose a price index rises from one hundred to 110 and then to 115.5. Inflation in the first interval is ten percent. In the second it is (115.5 - 110)/110, or five percent. Inflation has fallen, but prices have not returned to their starting level. This is disinflation: the rate of increase slowed while the level continued rising. Calling it deflation confuses a change in a rate with a fall in the level itself.
If the index instead falls from 110 to 104.5, the inflation rate is negative five percent. That is deflation over the specified interval. A decline in one good's price does not establish economy-wide deflation, because other prices and their weights may offset it. Equally, a rise in one prominent price does not identify the exact inflation rate of a broad basket. The index aggregates a defined set of prices using a specified method.
Rates also need a time unit. A two-percent monthly increase differs greatly from a two-percent annual increase. Compounding twelve monthly increases of two percent gives a factor of 1.02 raised to the twelfth power, not exactly 24 percent. Our assessed examples use intervals and numbers chosen for exact arithmetic, but the principle remains: compare like periods and distinguish simple annualisation from compounded growth.
Cumulative inflation multiplies successive gross growth factors. A ten-percent rise followed by a ten-percent fall does not restore the initial price level. Starting at one hundred, the two steps give 110 and then 99. The second percentage uses a larger starting level. This denominator discipline is the same one used for output growth and exchange rates; it is a general property of proportional changes rather than an exception invented for prices.
A fixed basket is a transparent teaching device, but household consumption changes over time. When one product becomes relatively expensive, consumers may substitute toward alternatives. A permanently fixed basket can overstate the expenditure needed to maintain a comparable level of satisfaction if substitution is possible and other conditions permit it. That is a statement about one potential index problem, not a numerical correction that can be applied without evidence about preferences and available substitutes.
Product quality also changes. A higher price for a substantially improved product is not straightforwardly the same as a higher price for an unchanged product. Statistical agencies use methods to distinguish price changes from quality changes, but these judgments can be difficult. New goods, changing outlets, discounts, and differences in transaction prices add further measurement questions. An index is constructed from a defined method and data, not read directly from one universal price tag.
Different households face different spending patterns. A household that uses public transport heavily and a household that walks can experience different personal cost changes even when both live in the same economy. A published aggregate consumer index represents its designated population and weighting system; it need not match every individual's experience. A personal budget calculation may be informative without replacing the broader statistical measure.
The GDP deflator and a consumer price index differ in scope. The former concerns domestic production, while the latter concerns consumer purchases in its specified basket or methodology. Imported consumer products can influence a consumer index; exported machinery can influence the domestic-output deflator without entering a household basket. Divergence between the indexes can therefore reflect coverage rather than an error. Read the definition before deciding which index suits a question.
Neither measure alone identifies why prices changed. A supply disruption, stronger aggregate spending, exchange-rate changes, or altered expectations could contribute through different mechanisms. A price index records an outcome. Explaining that outcome requires a model and evidence about causal conditions. Later aggregate-demand and supply lessons will make those alternatives explicit, instead of interpreting any observed inflation as proof of one predetermined cause.
Suppose a fictional one-year contract turns a deposit of one hundred dollars into 110 dollars, a ten-percent nominal return. Over the same year, the relevant price index rises from one hundred to 105, or five percent. The final dollars buy 110/105 times the initial basket quantity. The exact real gross return is therefore 1.10/1.05, not simply the difference between the two percentages.
The exact relationship is one plus the real rate equals one plus the nominal rate divided by one plus inflation. The familiar approximation real rate equals nominal rate minus inflation is close when rates are small enough for the desired precision. With ten-percent nominal return and five-percent inflation, the exact real rate is approximately 4.76 percent, while the subtraction approximation gives five percent. An assessment must specify whether it requests the exact calculation or the approximation.
For an exact terminating example, take a nominal return of ten percent and inflation of 25 percent. The final purchasing-power factor is 1.10/1.25 = 0.88, so the real return is negative twelve percent. The account contains more dollars, but those dollars command less of the comparison basket. A positive nominal rate does not guarantee a positive real return. Conversely, deflation can raise the purchasing power of a fixed nominal payoff.
The timing of inflation expectations matters. Before the contract begins, borrowers and lenders can form an expected real rate using expected inflation. Afterward, realized inflation determines the ex post purchasing-power outcome. If the nominal contract is fixed and actual inflation exceeds what was expected, the lender's realized purchasing-power return is lower than anticipated, while the borrower repays in dollars with lower purchasing power. This comparison assumes the relevant incomes and payments are not otherwise indexed or adjusted.
Unexpected inflation does not benefit every borrower or harm every lender in every institutional setting. Contracts can be indexed, interest rates can reset, taxes can affect returns, and incomes can respond differently. The simple fixed-nominal-contract example isolates one channel. It provides no recommendation to borrow or lend, and no forecast of future inflation. Its lesson is to state the nominal terms, the relevant price index, the time interval, and which inflation rate was known or expected at each decision date.
Changes in real wages use the same purchasing-power logic. If a nominal wage rises eight percent while the price index rises twenty percent, the real wage factor is 1.08/1.20 = 0.90, a ten-percent fall. That describes the wage's purchasing power relative to the index. It does not capture changes in hours, nonwage benefits, taxes, or the worker's personal basket unless those are separately included.
A fictional household's reference basket is ten meals and five bus trips. Its cost rises from fifty dollars to 65 dollars as the stated prices change. A report says that inflation was thirty percent for this unchanged basket. Another says that the household's welfare fell thirty percent. The first statement follows from the supplied price and quantity data; the second does not. A welfare comparison would require information about substitution, preferences, income, and other conditions.
The household receives 110 dollars at the end of the year for every one hundred dollars committed to a fictional fixed nominal contract. If the relevant index rises from one hundred to 125 over that same year, the exact real factor is 1.10/1.25 = 0.88. The nominal gain of ten dollars accompanies a twelve-percent loss of purchasing power relative to that index. The calculation is a retrospective model result, not advice about a financial product.
Suppose the household originally expected the index to rise only to 110. Its expected real factor was 1.10/1.10 = 1, or zero real growth. Actual inflation was greater than expected, so the realized real outcome is worse than that anticipated benchmark. This does not establish that the household made an irrational decision; expectations must be evaluated using information available at the time, which the scenario does not supply.
A careful summary separates the fixed-basket price comparison, the contract's nominal payoff, the exact realized real return, and the expected real return. Those are four distinct calculations with explicit denominators. Collapsing them into the sentence prices went up, so everyone lost equally would discard both the arithmetic and the scope of the evidence.
Disinflation can coexist with rising prices. A price index of 130 is not an inflation rate of 130 percent. An unweighted average of price changes need not equal a basket's cost change. Nominal interest minus inflation is an approximation, not the exact Fisher relationship. A measured average price change does not imply identical household experiences or a quantified welfare change.
State the basket quantities.
Ten meals and five bus trips.
Holding quantities fixed isolates the cost comparison.
Price the basket in the reference period.
10 × 4 + 5 × 2 = 50 dollars.
Reference prices establish the index denominator.
Price the same basket later.
10 × 5 + 5 × 3 = 65 dollars.
Only prices change between these two valuations.
Form and scale the cost ratio.
65/50 × 100 = 130.
The reference basket cost is scaled to one hundred.
Interpret the index within its scope.
The same basket costs thirty percent more.
Actual purchased quantities and welfare changes remain unspecified.
Record the three successive index levels.
100, 110, and 115.5.
All levels share one reference scale.
Calculate the first interval's rate.
(110 - 100)/100 = 10%.
The earlier level supplies the denominator.
Calculate the second interval's rate.
(115.5 - 110)/110 = 5%.
The denominator updates to the start of the second interval.
Compare the rates and levels separately.
Inflation falls from ten to five percent; the index still rises.
A slower positive rate does not imply a negative change in the level.
Name the measured pattern.
Disinflation, with cumulative prices above the starting level.
The classification follows from declining inflation rather than falling prices.
Record the nominal contract payoff.
100 dollars becomes 110 dollars.
The nominal gross-return factor is fixed at 1.10.
Record expected inflation.
Expected index 100 to 110: expected factor 1.10.
The ex ante calculation uses information anticipated before the outcome.
Calculate the expected real return.
1.10/1.10 - 1 = 0%.
Expected purchasing power is unchanged under that expectation.
Record realized inflation.
Actual index 100 to 125: actual factor 1.25.
The realized price change replaces the expected one in the retrospective calculation.
Calculate the realized real return.
1.10/1.25 - 1 = -12%.
Dividing gross factors gives the exact purchasing-power change.
State what the comparison does and does not establish.
The realized return is twelve percentage points below the expected zero-percent return.
It does not establish whether the original expectation was reasonable or recommend a future contract.
Convert the wage change into a gross factor.
An eight-percent nominal raise gives 1.08.
The factor includes the original wage as well as its increase.
Convert and apply the price change.
Twenty-percent inflation gives 1.20; 1.08/1.20 = 0.90.
Dividing adjusts the new wage for the basket's price change.
Express the purchasing-power change.
A fictional fixed basket contains four meals and six trips. Reference prices are five dollars per meal and five dollars per trip. Later prices are eight dollars per meal and three dollars per trip. Compute the two basket costs and the later index, with reference index one hundred.
| Value | |
|---|---|
| Reference cost dollars | |
| Later cost dollars | |
| Later index |
A fictional fixed basket cost forty dollars in the reference period and fifty-four dollars later. Complete its current index and price increase.
Form the basket-cost ratio.
54 divided by 40 = ratio.
The reference-period cost supplies the denominator.
Scale to a reference index of one hundred.
The later index is index.
Multiplying the ratio by one hundred produces an index level.
Convert the ratio into a growth percentage.
The basket-price increase is inflation percent.
Subtract the original unit from the ratio before multiplying by one hundred.
A fictional price index is 100, then 120, then 126 at three equally spaced annual dates. Calculate inflation for each interval and cumulative inflation from first to last.
| Percent | |
|---|---|
| First interval | |
| Second interval | |
| Cumulative |
Construct the critique of a report claiming that one household's actual spending increase measures price inflation exactly. Use the supplied facts and conclusion.
This task has no paper form; do it on a device.
A fictional one-year contract pays a nominal return of twenty percent. The relevant price index rises from 100 to 125. Compute the gross nominal factor, gross price factor, and exact real return percent.
| Value | |
|---|---|
| Nominal factor | |
| Price factor | |
| Exact real return percent |
In a fictional annual contract, a worker's nominal hourly wage rises from twenty to twenty-seven dollars. Over the same year the relevant consumer index rises from 100 to 125. Hours and other compensation are outside the question. Compute nominal wage growth and exact real hourly-wage growth percentages.
| Percent | |
|---|---|
| Nominal wage growth | |
| Exact real wage growth |
Lesson test: one question per skill, one attempt each, no hints. Your answers are checked when you submit.
A fictional basket costs eighty dollars in the base year and one hundred dollars one year later. A fixed nominal contract turns two hundred dollars into 220 dollars during that same year. Compute the later basket index, inflation percent, and exact real contract return percent.
| Value | |
|---|---|
| Later index, base 100 | |
| Inflation percent | |
| Exact real return percent |
You can match a price measure to its basket, interval, and purpose, and compute an exact real payoff from nominal terms. Next, distinguish labor-market rates that use different population denominators.
13. A nominal wage with a larger price increase, step 3
0.90 - 1 = -10% real wage growth.
More dollars can purchase less when prices rise sufficiently faster.