Calculate excess demand and excess supply at a stated price
Paper packet. Every task here also exists on screen, where it is checked automatically; answers written on paper are not assessed by Nydus. When you are back at a device, enter your answers there.
1. What you will learn
Calculate excess demand and excess supply at a stated price
2. Starting point
Demand and supply are conditional schedules. Compare buyers and sellers at the same price, for the same product, market and time period.
3. Words for this lesson
Term
What it means
Equilibrium price
A price at which quantity demanded equals quantity supplied in the specified model.
Equilibrium quantity
The common planned quantity at that price.
Excess demand
Quantity demanded minus quantity supplied when this difference is positive.
Excess supply
Quantity supplied minus quantity demanded when this difference is positive.
Price adjustment
A change in the price offered or accepted as participants respond to market conditions.
Market clearing
Compatibility of planned purchases and sales at the stated price.
4. Compare the two sides at one price
A market model brings buyers' and sellers' plans together. For each candidate price, read quantity demanded and quantity supplied from the corresponding rows. Their units and periods must agree. If buyers demand twelve notebooks per week and sellers offer twelve per week at three tokens each, the two plans are compatible at that price.
The equality defines equilibrium within this model. It is not a claim that everyone obtains everything they could ever want. Buyers with limited budgets make choices, and sellers compare the price with their opportunities. Some potential buyers may choose zero at the equilibrium price, while some potential sellers may not participate. Scarcity remains even when the supplied plans are equal.
Suppose a table lists prices two, three and four. Demand quantities are sixteen, twelve and eight; supply quantities are eight, twelve and sixteen. At two, the plans differ. At three, both are twelve. At four, they differ again. The listed equilibrium is therefore a price of three tokens and a quantity of twelve notebooks per week. Price and quantity are different outputs and need different units.
Read both values from the same scenario. Pairing demand at two with supply at four would compare plans made under different incentives. That combination cannot establish equilibrium at either price. The simple habit of keeping a row intact prevents a surprisingly common error: finding equal numbers somewhere in the table without checking whether they share the same price.
Another way: Measure excess demand
At a price where quantity demanded exceeds quantity supplied, the model has excess demand, also called a shortage at that price. With sixteen demanded and eight supplied, excess demand is eight. This is a difference between conditional plans. It is not the total quantity demanded and it is not a measure of all unsatisfied human wants.
In a simple immediate exchange with no other inventory or supply source, transactions cannot exceed the smaller offered quantity of eight. Even this maximum need not be reached if matching, information or other obstacles prevent some exchanges. The demand and supply table alone does not tell us which buyers receive the available units or how long they wait.
Participants may respond to excess demand in several ways. Some buyers may offer more; sellers may raise posted prices or accept higher bids. A higher price along fixed schedules tends to reduce quantity demanded and increase quantity supplied in the usual model. These responses can move plans toward equality, but they require a market arrangement that permits price changes and actual behavior consistent with the model.
Do not treat upward pressure as a guaranteed immediate jump to a unique number. Prices can be fixed by agreement, adjustment can take time, and people may lack information. Allocation might involve lines, rationing, relationships or chance. The model identifies a mismatch and a possible adjustment mechanism; further institutional details determine what happens in practice.
Another way: Measure excess supply
At a price where quantity supplied exceeds quantity demanded, the model has excess supply, sometimes called a surplus at that price. With sixteen offered and eight demanded, excess supply is eight. Subtract demand from supply in this case. Reversing the subtraction gives a negative number that can be useful in a signed-gap convention, but it is not a positive surplus quantity.
Unsold offers may give sellers a reason to lower prices or reduce future production. In the usual fixed schedules, a lower own price increases quantity demanded and reduces quantity supplied. This can reduce the mismatch. Again, the argument describes incentives and possible adjustment, not an automatic rule that every seller instantly follows.
Inventory and timing affect interpretation. Goods already produced might be stored, discounted, repurposed or discarded. Services offered for a particular hour cannot usually be stored for later sale in the same way. A seat on a departed bus and a notebook in a warehouse have different storage possibilities. A market table abstracts from these details unless the case supplies them.
Keep excess supply distinct from a firm's profit. A seller can have unsold goods and still earn positive profit on other sales, or sell every unit and make a loss if costs are high. The excess-supply calculation compares quantities at a price; it does not include the full revenue and cost information needed for profit. Similar everyday words can name very different economic measurements.
Another way: Locate equilibrium in a discrete table
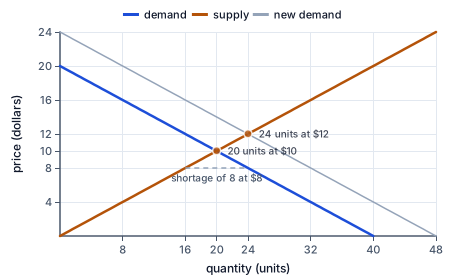
Price in dollars against quantity in units. Demand Qd = 40 - 2P falls and supply Qs = 2P rises; they cross at 20 units and 10 dollars. At 8 dollars buyers want 24 and sellers offer 16, a shortage of 8. Demand shifted out to Qd = 48 - 2P crosses the same supply curve at 24 units and 12 dollars.
The figure shows the same comparison on a graph: below the crossing price, buyers want more than sellers offer, a shortage, and at the crossing the two plans agree.
For a table with several candidate prices, calculate the gap in each row. We can define the signed gap as quantity demanded minus quantity supplied. A positive result indicates excess demand, a negative result indicates excess supply, and zero indicates compatible plans. State this sign convention explicitly before using it so that negative values are interpreted consistently.
For the example, the gaps at prices two, three and four are eight, zero and negative eight. The zero row identifies equilibrium among the listed scenarios. Writing all three gaps is also a useful check: it shows that the selected row is not merely one where quantities happen to look close. The equality must be exact unless the task specifies a tolerance or approximation.
A table does not always contain an equality. If the gap is positive at two and negative at four, an equilibrium between them may exist under continuous demand and supply assumptions. But a discrete table alone does not supply the exact intermediate schedules. Do not report three automatically. Linear interpolation would need to be stated or justified by additional information.
Some models can have multiple equilibria or no equilibrium under the specified rules. Our introductory exercises deliberately provide a single exact equality so learners can practice the basic method. That convenient construction is not a theorem about every real market. When later models are more complex, the same discipline applies: use the actual equations or schedules and report what they establish.
Another way: Equilibrium is a model result, not a moral verdict
Market clearing describes compatibility of buying and selling plans. It does not by itself establish fairness, adequate living conditions or the best possible social outcome. The distribution of income affects purchasing ability, and a low-income person's urgent need may appear as little effective demand. Equal quantities in a table do not resolve that concern.
Efficiency claims also require additional assumptions. Competition, information, effects on outsiders and property rights can matter. If production causes harm to people outside the transaction, the market's private schedules may omit part of the social cost. An equilibrium may still exist while the outcome raises an externality problem. Later lessons will examine these conditions explicitly.
Nor does a change in equilibrium automatically tell us who gains. A higher price can affect buyers and sellers differently, and the change in quantity also matters. Some sellers may face rising costs at the same time. An assessment of gains needs more than the direction of the price arrow. Avoid labeling every price rise good for all producers or bad for society without further evidence.
A careful statement keeps the analytical and evaluative questions visible. We can say that the supplied model clears at three tokens and twelve notebooks, then separately ask whether the distribution, conditions and effects are acceptable. Separating those questions does not make fairness unimportant. It prevents a narrow calculation from being used as an unsupported answer to a broader question.
Another way: Use adjustment reasoning as a conditional explanation
To explain a movement toward equilibrium, begin with a stated starting price and the resulting gap. Then identify a behavior that could change price and show how each side's planned quantity responds on its fixed schedule. The explanation needs this chain. Simply writing 'the market fixes it' hides the choices and institutions doing the work.
For instance, at two tokens the example has eight units of excess demand. If sellers can raise prices and buyers respond according to the supplied demand schedule, moving to three reduces demand from sixteen to twelve while raising supply from eight to twelve. The plans then match. Both sides of the adjustment contribute, so it is incomplete to describe only increased production.
The schedules must remain fixed for that specific comparison. If publicity simultaneously attracts new buyers, the original equilibrium may cease to apply. If a supplier loses capacity, supply changes too. A moving target can make adjustment difficult to infer from observed prices. Models simplify the situation to isolate mechanisms; evidence determines how well the simplification fits a particular setting.
After finding equilibrium, check units, row consistency and the equality itself. Report the price per unit and the flow quantity per period. If the question instead asks about a non-equilibrium price, answer the requested gap rather than substituting the equilibrium result. Being able to identify the question is part of economic reasoning: the same table can support several different, correctly bounded answers.
5. A fictional market for workshop places
An organizer models places in an afternoon workshop. At a fee of two tokens, twenty participants plan to attend and instructors offer twelve places. At four tokens, sixteen are demanded and sixteen supplied. At six tokens, twelve are demanded and twenty supplied. The model assumes identical places, compatible timing and fixed participant preferences and instructor costs.
At two tokens, excess demand is eight places. That does not tell us which twelve participants would attend, nor guarantee that all offered places are matched with buyers. At six tokens, excess supply is eight places. The supplied table clears at four tokens and sixteen places, where planned purchases and offers agree exactly.
If the fee can change, the lower-price mismatch can create pressure for a higher fee. Moving from two to four in the model reduces planned attendance by four and increases offered places by four. Together these changes close the eight-place gap. This arithmetic explains the adjustment more precisely than saying only that instructors add capacity.
The organizer also cares about access for participants with few tokens. Market clearing does not answer that policy question. A scholarship, a different allocation rule or additional publicly funded places would change the relevant conditions and require a revised analysis. The original table remains a useful baseline, but its equilibrium is not a complete recommendation. This example shows how a model can answer a precise question while leaving important institutional and distributional questions open.
6. A tempting mistake
Equality of planned buying and selling is not proof of fairness or guaranteed instant adjustment. A shortage or surplus must be measured at a specified common price.
7. Find a clearing row
Read candidate prices.
P=2,3,4
Each row is a separate scenario.
Compare the first row.
D=16, S=8
The quantities do not match.
Compare the middle row.
D=12, S=12
Both plans are equal.
Check the last row.
D=8, S=16
This row also has a mismatch.
Report both equilibrium values.
P=3 tokens, Q=12 per week
Price and quantity come from the same clearing row.
8. Measure a shortage
Read the price.
P=2
The gap is conditional on this price.
Read planned purchases.
D=16
Demand is not the completed transaction count.
Read offered quantity.
S=8
Supply is the other side's plan.
Subtract supply from demand.
16-8=8
The positive difference is excess demand.
Bound possible immediate trades.
At most 8 under these offers
Availability and matching limit transactions.
9. Explain a conditional adjustment
Start below the clearing price.
P=2, D=16, S=8
There is excess demand in this table.
State the adjustment assumption.
Sellers can raise price
A price-control or fixed agreement could prevent this step.
Move to the next supplied price.
P=3
Other influences remain fixed.
Read the buyer response.
D falls by 4 to 12
This is movement along fixed demand.
Read the seller response.
S rises by 4 to 12
This is movement along fixed supply.
Check the resulting compatibility.
12-12=0
The two responses together close the original eight-unit gap.
10. Complete a surplus calculation
Read a common-price row.
D=9, S=14
Both plans are daily quantities.
Compute the signed gap.
9-14=-5
Demand minus supply is negative.
Your turn: work this step out. Its working is at the end of the packet.
Name the positive mismatch.
11. Guided practice
At price 2 tokens per unit, quantity demanded is 18 and quantity supplied is 10 per day. Use signed gap = demanded minus supplied. Enter this gap, excess demand (zero if absent), and excess supply (zero if absent).
Your result
Signed gap
Excess demand
Excess supply
12. Guided practice
At one price, seventeen units are demanded and eight supplied. Fill the shortage calculation.
Compare the plans.
17 > 8
Demand is the larger quantity.
Subtract offered units.
17-8=gap
The difference measures excess demand at this price.
Check the account.
8+gap=17
Offered units plus the unmet planned quantity reconstruct demand.
13. Guided practice
Match each row to its market condition.
Equilibrium
Excess demand
Excess supply
D=12, S=12
D=15, S=9
D=6, S=11
14. Practice
A fictional market lists complete candidate rows (price tokens per unit; demanded; supplied), all quantities per day: (2;21;9), (4;15;15), (6;9;21). Select the clearing price and quantity among these rows. Also compute signed demand-minus-supply gaps at prices two and six. Do not combine quantities from different rows.
Equilibrium price: b0
Equilibrium quantity per day: b1
Signed gap at price 2: b2
Signed gap at price 6: b3
15. Practice
At price 5 tokens per unit, quantity demanded is 14 and quantity supplied is 14 per day. Use signed gap = demanded minus supplied. Enter this gap, excess demand (zero if absent), and excess supply (zero if absent).
Your result
Signed gap
Excess demand
Excess supply
16. Somewhere new
At price 3 tokens per unit, quantity demanded is 24 and quantity supplied is 15 per day. Use signed gap = demanded minus supplied. Enter this gap, excess demand (zero if absent), and excess supply (zero if absent).
Your result
Signed gap
Excess demand
Excess supply
17. Lesson test
Lesson test: one question per skill, one attempt each, no hints. Your answers are checked when you submit.
18. Test question
For a fictional daily market, the complete candidate rows are (price tokens per unit; demanded; supplied): (3;20;8), (5;14;14), (7;8;20). Find equilibrium price and quantity among the listed rows, then the positive shortage at price three and positive surplus at price seven.
Equilibrium price: b0
Equilibrium quantity per day: b1
Shortage at price 3: b2
Surplus at price 7: b3
19. What you can do now
Explain how to calculate excess demand and excess supply at a stated price. Show a fresh example and check its result.
Working for the steps left to you
10. Complete a surplus calculation, step 3
Excess supply=5
Offered quantity exceeds planned purchases by five.