Back to the on-screen lesson ·
Explain a location choice through stated costs, networks and policy.
Paper packet. Every task here also exists on screen, where it is checked automatically; answers written on paper are not assessed by Nydus. When you are back at a device, enter your answers there.
Explain location choices across agriculture, industry and services using costs, production links, risk and distributional consequences.
Recall that accessibility changes land-use advantages and that a region-wide gain can coexist with a local cost. You will add comparable cost components and trace dependencies across a chain. Keep fixed costs separate from costs per unit, and compare the same production volume and period at each candidate site. A low wage is not automatically a low labor cost per unit if productivity differs.
| Term | What it means |
|---|---|
| Agglomeration | Benefits or costs arising from activities locating near one another. |
| Value chain | Linked activities that add value from inputs through final use. |
| External cost | A consequence borne by people or environments outside the modeled private transaction. |
| Resilience | The ability to maintain specified functions through a disturbance. |
Economic location concerns where activities occur and how they connect. Agriculture supplies biological materials, industry transforms inputs, and services coordinate transport, finance, information, retail and maintenance. A finished product can connect farms, factories, ports, offices and consumers across several regions. Describing only the final assembly site misses much of the geography of production.
A location model compares relevant costs and benefits for a specified actor. A firm may compare transport, labor, land, energy and delay costs. Workers may compare wages, housing and travel. Communities may compare employment, exposure, water demand and public revenue. These perspectives can produce different rankings without any arithmetic contradiction. State whose decision is being modeled, what the cost boundary includes and which consequences remain outside it. All monetary values and production chains in this lesson are hypothetical instructional examples.
Another way: table
| Annual modeled cost (credits) | River site | Junction site |
|---|---|---|
| Inputs and freight | 40 | 25 |
| Labor and training | 30 | 40 |
| Energy and premises | 20 | 20 |
| Expected delay | 15 | 5 |
| Total | 105 | 90 |
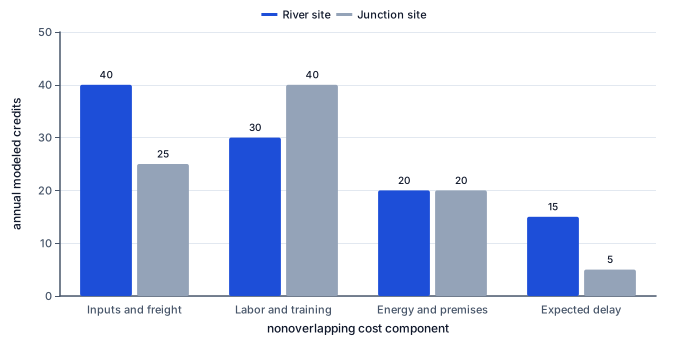
Each paired group compares one annual cost component for the same output at River and Junction. Read the component labels horizontally and credits vertically. River spends 15 credits more on inputs and freight and 10 more on expected delay, while Junction spends 10 more on labor and training; energy and premises are equal. Adding all four components gives 105 credits for River and 90 for Junction. The labor advantage alone would give the wrong ranking. Neither the chart nor the table includes community exposure or water impacts, which require separate evidence before a public recommendation.
The fictional River site has lower labor and training cost than Junction, but its freight and delay costs are higher. Adding all four components gives 105 credits at River and 90 at Junction. Choosing River solely because labor costs 30 rather than 40 ignores components that more than offset that advantage. A location explanation should identify the decisive difference in the total, not simply the most visible low number.
Check that cost categories do not overlap. If freight already includes expected delay penalties, adding a second delay allowance would double count. If one site's premises cost includes energy while the other's does not, the totals are not comparable. A transparent table states what each component covers and the period to which it refers.
Output must also be comparable. A site producing twice as many units may have higher total cost but lower cost per unit. Divide by output when the decision concerns unit efficiency, and retain total cost when the question concerns a fixed production plan. Neither measure alone captures worker conditions, environmental effects or the reliability of the output.
Consider an invented canned-fruit chain. Farms grow fruit, a processing plant washes and cans it, packaging suppliers provide containers, a logistics company moves shipments, and retailers sell the product. Finance, maintenance, inspection and data services support the chain. A disruption at a service node can stop physical production even when farms and factories remain intact.
Different stages favor different locations. Perishable inputs may favor processing near farms or reliable cold storage. Bulky packaging may favor efficient freight links. Headquarters may value specialized labor and communication connections. Retail depends on customers' access and purchasing power. These are conditional mechanisms, not rules that every chain follows.
Map both material and information flows. A line from farm to factory shows a shipment path, but a contract or price signal may travel in another direction. Ownership and decision-making can be concentrated far from production. Ask where value is captured as well as where goods move. A region can produce a large share of the physical output while receiving a small share of the final sale price.
Firms near related activities may share suppliers, trained workers and specialized services. A machine-repair cluster can reduce downtime for nearby factories. Workers may benefit from several employers within reach, and information can circulate through professional networks. These are agglomeration mechanisms that can reinforce an established center.
Concentration can also raise land prices, congestion and competition for water or labor. A cluster may be vulnerable if many firms depend on the same port, power supply or narrow range of products. The presence of many firms does not by itself establish resilience. Their dependencies may be highly correlated.
A location model should therefore inspect both density and diversity of connections. Two suppliers in the same floodplain are not equivalent to two suppliers with independent exposure. A distant alternative may cost more in ordinary conditions but preserve production during a disruption. Define the function to be maintained, the disturbance considered and the time horizon before calling a network resilient.
Global production can connect a local job to distant demand, exchange-rate conditions, shipping routes and corporate decisions. It can expand markets and opportunities while exposing communities to shocks beyond local control. A change in a distant buyer's contract may alter employment in a factory town even when local productivity has not changed.
Do not treat a country as a single economic actor with one interest. Workers, owners, consumers and governments may experience a production change differently. A low export price can benefit buyers while reducing producers' incomes. An efficient transport corridor can lower regional costs while increasing truck traffic in a particular neighborhood.
Environmental and social evidence belongs in the explanation, not as an afterthought. A water-intensive plant may appear inexpensive where water prices omit ecological scarcity. A subsidy may lower the firm's private cost while increasing public expenditure. State these differences explicitly. Comparing private costs is a legitimate bounded task, but calling the cheapest private site the best overall location requires additional objectives and evidence.
Recalculate totals and identify the margin between candidates. If Junction is cheaper by 15 credits, ask whether an uncertain energy cost or freight disruption could reverse the ranking. A sensitivity test changes one assumption at a time or presents a clearly defined scenario. It does not quietly change several inputs until a preferred site wins.
Next test the network. Which inputs have substitutes? Which routes are bottlenecks? How long can stored materials support production? A supplier map should distinguish active contractual supply from a merely possible source. A straight line on a map is not evidence of capacity, reliability or permission to trade.
Finally, connect the recommendation to its decision boundary. A firm-focused conclusion might favor Junction under the stated annual cost assumptions. A public planning conclusion must also consider employment access, water demand, exposure and distribution of benefits. Specify what is established by the supplied calculation and what requires further investigation or human judgment. A defensible recommendation can be conditional and still be useful.
A fictional fruit processor can locate near orchards or near a port. The orchard site saves 20 credits in fresh-fruit transport but adds 35 in container and export logistics. If other modeled costs are equal, the port site is cheaper by 15 credits. However, the orchard site may reduce spoilage during peak harvest, an effect omitted from the initial figures. Estimate its magnitude before deciding whether it reverses the ranking.
The analysis should also examine water use, seasonal employment and workers' travel. A processing plant can connect agricultural production to industrial transformation and global services, with benefits and burdens distributed across different places. A map of the final factory alone would miss those connections. The learning task is to make the chain and assumptions explicit, not to infer a universal preference for ports or farms.
An invented manufacturer needs 10 units of input each day and holds 40 units in stock. The stock supports four days of production if deliveries stop and use stays constant. A primary route usually delivers in two days but can close for a week; a backup route takes five days and costs more. Activating the backup only after a closure may leave a one-day gap unless additional stock or reduced production is available.
A resilience plan compares the cost of inventory, alternative supply and interruption. It also checks whether the backup route shares the same vulnerable bridge. Two routes drawn separately can still depend on one bottleneck. The relevant geographic evidence is the structure and capacity of the network, not the number of lines on a schematic map.
Labor cost per unit depends on wages, productivity, training and turnover, while location cost includes many nonlabor components. Even a correctly identified private-cost minimum does not include every public consequence. Avoid replacing one simplistic rule with another, such as assuming the most connected site is always best. Connectivity can provide both opportunity and shared vulnerability, depending on the network.
Add River's comparable components.
40+30+20+15 = 105 credits.
All costs refer to the same annual output.
Add Junction's components.
25+40+20+5 = 90 credits.
The categories use the same definitions.
Find the modeled advantage.
105-90 = 15 credits.
Junction has the lower private cost.
State the excluded consequences.
Water and community exposure are outside this table.
The ranking is not a complete public recommendation.
Identify the primary activity.
Orchards produce fruit.
Agriculture supplies the biological input.
Identify the transformation.
A plant cans the fruit.
Industry changes the product's form.
Identify supporting services.
Logistics, finance and maintenance connect operations.
Services enable material production.
Trace a distant dependency.
A buyer's contract changes factory demand.
Economic control can lie outside the producing region.
Ask where value is captured.
Compare payments to farms, workers and other actors.
Physical output does not measure each actor's benefit.
Read daily input demand.
10 units per day.
Use is assumed constant.
Read available inventory.
40 units.
Only usable stock counts.
Calculate days of operation.
40/10 = 4 days.
Inventory is divided by daily consumption.
Compare backup arrival time.
5 days exceeds stock cover by 1 day.
A route can exist yet arrive too late.
Inspect common exposure.
Check whether both routes cross the same bridge.
Shared bottlenecks defeat apparent redundancy.
Bound the resilience claim.
Continuity requires timely independent supply or more stock.
A second route alone is insufficient.
Calculate the first total.
30+25+15 = 70 credits.
Add nonoverlapping components.
Calculate the second total.
20+35+10 = 65 credits.
Use the same output and period.
State the private-cost margin.
A factory site saves 14 credits in labor but adds 30 in freight, with other costs equal. Which conclusion follows?
Complete the calculation. A hypothetical site has 58 credits in production costs and 12 additional credits in freight for the same batch. What is its modeled total?
Add production and additional freight costs.
r
Add the nonoverlapping cost components for the same output.
Check that freight was not already included.
Check the units and the stated comparison.
Double counting would overstate the site total.
Keep external consequences separate from the stated private-cost total.
Keep the result within the supplied observations.
Compare complete, compatible costs and trace the production network before extending a private-cost result to a public judgment.
Order a location-cost analysis for a processor.
Number the steps in order (write the number in the box):
A production network claims resilience because it has two suppliers. Select necessary checks.
This task has no paper form; do it on a device.
Match each production-chain activity to its function.
| Agricultural input production | Industrial transformation | Service connection within the production network | |
|---|---|---|---|
| Growing the fruit | |||
| Canning the fruit | |||
| Coordinating storage and shipments |
A hypothetical site has 60 credits in production costs and 18 additional credits in freight for the same batch. What is its modeled total?
Answer: credits
Site A costs 73 for production plus 12 for freight. Site B saves 5 in production but adds 10 in freight relative to A. Enter both totals.
| credits | |
|---|---|
| Site A total | |
| Site B total |
An unfamiliar fruit chain links farms, a canning plant and export logistics. Moving the plant to a port saves 13 credits privately but increases irrigation demand upstream and lengthens workers' journeys. Which explanation is strongest?
Lesson test: one question per skill, one attempt each, no hints. Your answers are checked when you submit.
Two invented sites make an identical batch. Inland has production cost 62 credits and freight 13. Port production is 10 credits cheaper, but freight is 18 credits higher. Construct each complete private cost and Port minus Inland. Do not count the production saving while omitting the freight penalty; worker travel and environmental costs remain outside this account.
| credits per batch | |
|---|---|
| Inland total | |
| Port total | |
| Port minus Inland |
Explain why the cheapest factory site can differ from the site with the lowest total social and environmental cost.
17. Two sites have comparable annual costs of 30+25+15 and 20+35+10 credits. Complete the cost comparison., step 3
70-65 = 5 credits in favor of the second site.
Other consequences remain outside this comparison.