Back to the on-screen lesson ·
Evaluate a population policy through stated aims, evidence and effects.
Paper packet. Every task here also exists on screen, where it is checked automatically; answers written on paper are not assessed by Nydus. When you are back at a device, enter your answers there.
Evaluate a population policy using its stated aim, suitable denominators, comparison evidence, rights and unequal effects.
Recall that births minus deaths gives natural increase and arrivals minus departures gives net migration. A crude rate divides an event count by the whole population, while an age-specific rate uses the relevant age group. Also recall the comparison of changes from spatial association: a before-and-after difference can reflect wider trends rather than an intervention alone.
| Term | What it means |
|---|---|
| Population momentum | Continued population change associated with the existing age structure. |
| Crude rate | An event rate using the total population as denominator. |
| Policy outcome | A condition the policy seeks to change, distinct from the activity it funds. |
| Comparison group | A group used to assess change beyond a common background trend. |
Population policies seek to influence demographic conditions or respond to them. Their aims may concern access to services, family support, migration, age structure or the distribution of people across a region. Evaluating a policy begins by identifying the stated objective and the people affected. A change in population size alone cannot reveal whether a policy achieved its intended outcome, whether it caused the change, or whether the means respected people's rights.
Separate demographic accounting from policy evaluation. Births, deaths, arrivals and departures explain how a population total changes. A causal explanation asks why those flows changed. A normative evaluation asks whether the policy's objectives, implementation and consequences are acceptable under explicit principles. Those questions need different evidence. The policies and time series in this lesson are invented; they do not describe current law or recommend personal reproductive or migration decisions.
Another way: table
| Relative year | Policy births per 1000 | Comparison births per 1000 |
|---|---|---|
| -2 | 24 | 22 |
| -1 | 23 | 21 |
| 0 | 22 | 20 |
| 1 | 20 | 19 |
| 2 | 18 | 18 |
An invented district funds childcare to reduce barriers faced by caregivers. Counting new childcare places measures an output: what the program delivered. Measuring whether caregivers can obtain affordable places during working hours addresses access, an intended outcome. A birth count is a different demographic measure and may not be the most direct way to evaluate this policy's stated aim.
Write an evaluation question that identifies the population, place, period and outcome. For example: did access to affordable childcare improve for caregivers in the district during the two years after implementation, and how did access differ by neighborhood and work schedule? That question points to prices, opening hours, waiting lists and household evidence. It also reveals that a district average may hide exclusion.
Avoid choosing a convenient indicator simply because it is available every year. A program designed to improve voluntary access to services cannot be judged adequately by a target number of births or departures. The indicator should reflect the objective without rewarding coercion, exclusion or manipulation of the count. Record both intended outcomes and plausible unintended effects.
Suppose a fictional population contains 10000 people and records 200 births in a year. Its crude birth rate is 20 per thousand. If the number of people in childbearing ages falls while their age-specific birth rates remain unchanged, total births can fall. A lower crude rate therefore need not mean that individual family preferences changed or that a policy altered behavior.
Population momentum also matters. A population with many young people can continue growing as those cohorts enter adult ages, even if rates of childbearing decline. An older population can experience more deaths because more people are at ages with higher mortality, without any deterioration in age-specific health conditions. The age structure carries the consequences of earlier demographic processes into the present.
For comparisons, inspect age composition and use appropriately defined age-specific or standardized measures when the question requires them. Do not substitute a total-population denominator for a group-specific question. If a policy concerns school access, the number and location of school-age children are more relevant than the total population alone. Explain why the denominator fits the outcome.
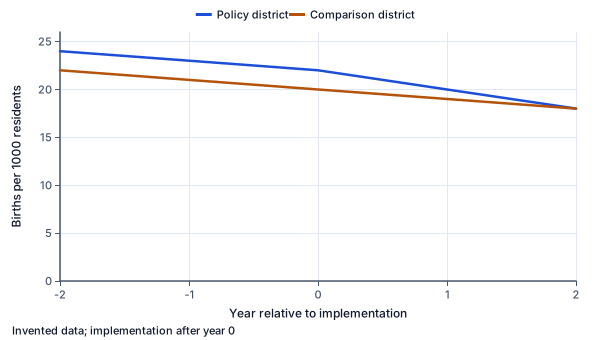
The table follows two fictional districts from two years before implementation to two years after. Before the policy, both crude birth-rate series fall by one per thousand each year. From year 0 to year 2, the policy district falls from 22 to 18, a change of minus 4. The comparison district falls from 20 to 18, a change of minus 2. The difference in changes is minus 2 births per thousand.
Earlier parallel movement supports, but does not prove, the assumption that the comparison district represents a useful counterfactual trend. The two districts might experience different age-structure changes, migration, employment shocks or reporting revisions after year 0. A graph cannot remove these possibilities. It makes the timing and contrast visible so the design can be scrutinized.
Do not treat the crossing or convergence of lines as an ethical verdict. The chart measures one crude demographic indicator. Whether a policy met its stated aim or respected affected people requires other evidence. A program could alter a rate while failing on access or rights; it could improve access without producing an immediate demographic change.
A policy analysis should distinguish voluntary support from coercive restrictions. In the fictional cases, ask whether people can make informed choices, whether services are accessible without discrimination, and whether benefits or penalties fall unevenly across groups. Do not infer that a numerical demographic target justifies any means used to achieve it.
Distribution matters within the district. A subsidy may be available in principle but inaccessible to people with irregular working hours or distant addresses. A migration incentive may attract workers while leaving housing and schools underprovided. A service program may reach central neighborhoods first, widening a gap even as the district average improves.
Use evidence appropriate to each concern. Administrative counts can show enrollment; household surveys can investigate unmet demand; interviews can reveal barriers and experiences; budgets can show resource allocation. Each source has limitations. People excluded from a program may be absent from its administrative records, so a satisfaction survey of enrolled users alone cannot establish equitable access. Evaluate the sampling frame as carefully as the reported percentage.
Check the demographic accounting first. A town with 200 births, 150 deaths, 100 arrivals and 180 departures changes by 200 minus 150 plus 100 minus 180, or minus 30 people. Calling this decline a failure of birth policy ignores migration and the policy's actual aim. It also confuses a demographic total with an evaluation criterion.
For the difference in changes, use final minus initial for both districts. If both series fall by the same amount, the contrast is zero. If the policy district falls less, the contrast is positive even though its own rate fell. The sign describes a comparison, not whether the policy is desirable.
Then check causal and ethical claims separately. Is the comparison group plausible? Were definitions stable? Did other interventions occur? Are subgroup outcomes available? Does the recommendation specify whose welfare and which rights it considers? A bounded evaluation may conclude that the observed rate changed more in one district while causal attribution and broader policy success remain unresolved. That is a precise result, not an absence of analysis.
Read year along the horizontal axis and crude births per thousand residents vertically. The policy district's steeper fall occurs after year 0. Compare slopes before implementation as well as changes afterward. The zero-based vertical axis keeps the size of the change visible in relation to the full rate; it does not remove confounding by age structure or other events.
A fictional town loses 30 residents overall during a year, yet a new housing development gains 80 school-age children through migration. Closing a school solely because the total population declined would miss the age and location of demand. Compare births several years earlier, current age cohorts, household moves and available places by catchment. The relevant planning question is not simply whether the town grows.
A policy response might improve transport, expand one site or repurpose another. Each option has distributional effects: longer journeys can burden families differently, and a new building may take years to open. Population evidence informs these choices but does not replace consultation about access and community needs. Use a time horizon that follows the children who will actually need places.
An invented program creates 120 childcare places, but only 90 are filled. A superficial evaluation reports low demand. A household survey finds 60 caregivers needing evening care, while every funded place closes before evening shifts begin. The vacancy count and unmet need can coexist because the service does not match users' schedules.
A revised evaluation compares affordability, hours, distance and waiting times across neighborhoods. It also examines whether the survey reached caregivers outside formal employment. Success should be assessed against improved usable access, not merely a filled-place target or a desired birth count. A human review of the evidence can weigh those outcomes and identify design changes. The automated activities in this lesson check bounded calculations and inferences, not the ethical adequacy of an actual policy.
A rate can change because of age composition, migration, background trends or measurement changes. Even a causal effect on the chosen rate is not automatically a desirable outcome. The policy must be assessed against its stated aim, means, distribution and unintended consequences. Conversely, no immediate demographic effect does not prove that improved service access has no value. Match the measure and time horizon to the claim.
Calculate natural increase.
200-150 = 50 people.
Births add and deaths subtract.
Calculate net migration.
100-180 = -80 people.
More people leave than arrive.
Combine the two balances.
50-80 = -30 people.
Both contribute to total change.
Separate accounting from evaluation.
The decline does not identify a policy cause.
A total mixes several processes.
Find the policy-district change.
18-22 = -4 per thousand.
Compare year 2 with year 0.
Find the comparison change.
18-20 = -2 per thousand.
Use the identical period.
Subtract the changes.
-4-(-2) = -2 per thousand.
The policy series fell two points more.
Inspect earlier trends.
Both fell one point annually before year 0.
This supports a comparison assumption.
State the remaining uncertainty.
Age structure and other changes may differ afterward.
Parallel history does not guarantee a causal estimate.
Read funded capacity.
120 childcare places.
This measures program output.
Read current use.
90 filled places.
Vacancies do not reveal their cause.
Read unmet demand.
60 caregivers need evening care.
The service hours do not match their need.
Identify the indicator mismatch.
Filled daytime places cannot measure evening access.
The target outcome is usable care.
Select further evidence.
Compare hours, fees and journeys by neighborhood.
Access has several dimensions.
Bound the recommendation.
Revise the service design and evaluate distribution.
A birth-rate target would not answer this question.
Compute the policy change.
20-25 = -5.
Use final minus initial.
Compute the comparison change.
21-23 = -2.
Keep the same direction.
Subtract and qualify.
A caregiver program funds 98 daytime places, but its stated aim is affordable care for evening workers. Which evaluation is most relevant?
Complete the calculation. A fictional district's crude rate starts at 29 per thousand and falls by 2 per thousand. What is the final rate?
Subtract the decline from the baseline rate.
r
Subtract the stated decline while retaining the per-thousand unit.
Check that a decline gives a lower rate.
Check the units and the stated comparison.
The direction describes the measured series.
Do not interpret the rate calculation as proof of policy success.
Keep the result within the supplied observations.
Separate demographic change, causal attribution and policy value; use an indicator that matches the stated aim.
Order a population-policy evaluation.
Number the steps in order (write the number in the box):
A policy report calls a lower crude birth rate proof of voluntary access and causal success. Select valid challenges.
This task has no paper form; do it on a device.
Match each observation to the evaluation question.
| What output was delivered? | Did usable access improve? | Could demographic composition explain a crude-rate change? | |
|---|---|---|---|
| Number of funded childcare places | |||
| Affordable evening places reachable by caregivers | |||
| Age composition before and after the policy |
A fictional district's crude rate starts at 28 per thousand and falls by 5 per thousand. What is the final rate?
Answer: per thousand
The policy district's rate falls by 5 per thousand and the comparison district's by 2. Enter the policy change and the policy-minus-comparison change.
| per thousand | |
|---|---|
| Policy change | |
| Difference in changes |
An unfamiliar policy district's crude rate falls 4 points more than a comparison district's, but their age structures change differently. The policy aimed to improve voluntary care access. Which judgment is warranted?
Lesson test: one question per skill, one attempt each, no hints. Your answers are checked when you submit.
Two fictional districts begin with crude birth rates of 29 births per 1000 residents per year. The policy district's rate falls by 6; the comparison district's falls by 2 over the same period. Construct the final rates and the policy-minus-comparison difference in changes. Do not claim a causal effect without checking earlier trends and population composition.
| births per 1000 residents per year | |
|---|---|
| Policy final rate | |
| Comparison final rate | |
| Difference of changes |
Explain why a crude birth-rate decline after a policy does not establish either causal success or an ethically acceptable outcome.
17. A policy district's rate falls from 25 to 20; a comparison rate falls from 23 to 21. Complete the difference in changes., step 3
-5-(-2) = -3 per thousand.
A causal interpretation needs a defensible comparison.