Back to the on-screen lesson ·
Seeing a pattern, asking why, gathering physical and human evidence, suggesting an explanation and checking it, with Iceland and Alaska as the worked cases.
Paper packet. Every task here also exists on screen, where it is checked automatically; answers written on paper are not assessed by Nydus. When you are back at a device, enter your answers there.
You will follow the steps of a geographical explanation, tell a pattern from its evidence and from a guess, and choose the evidence that would test a claim.
In this course you have explained where the rain falls, where the deserts are, where earthquakes happen, where people crowd and why cities grow. Every one of those explanations was built the same way. This lesson names the steps, so you can use them on any pattern you meet.
| Term | What it means |
|---|---|
| Pattern | An arrangement you can see: where something is and where it is not. |
| Evidence | Facts, measurements and maps that could support or weaken an explanation. |
| Claim | A statement that something is true. |
| Physical evidence | Evidence about nature: land, water, climate, ice. |
| Human evidence | Evidence about what people have built or decided. |
| Correlation | Two things that rise or fall together. |
Geographers work in the same order every time: first see the pattern — where something is, and where it is not — and only then ask why. A reason that is offered before anybody has looked carefully is a guess, however sensible it sounds.
Take Iceland. See: about two out of every three Icelanders live in and around Reykjavik, in the southwest, and the middle of the country is almost empty. Ask: why? Gather evidence of both kinds. Physical: the middle is high and cold, with glaciers and old lava; the southwest coast has flat land and is kept milder by a warm ocean current. Human: the capital, the parliament, the main airport, the biggest port and most jobs are there. Suggest: people live where the land is easiest and the work is. Check: does anything not fit? The northern town of Akureyri is the biggest outside the southwest; it is also on the coast with a harbor, so it fits too.
Checking is the step people skip. A familiar story can sound right and still be wrong, and two things that rise together may both be caused by a third.
Another way: steps
Another way: story
A detective does not arrest the first person who looks guilty. The detective gathers clues, suggests who did it, and then checks whether every clue fits. A geographer treats a pattern the same way: the map is the scene, the evidence is the clues, and the explanation must fit them all.
Suppose two invented villages have comparable soil and rainfall, but only one gained a bridge and that village grew afterward. An explanation using only shared soil cannot account for all of the contrast. Access to work is a better candidate because the bridge differs between the villages. Still, growth after construction is not proof that the bridge caused it: a school or factory may have opened too. Seek records that distinguish the explanations, such as dated job changes and residents' reasons for moving. Explain what each map shows and what it omits before relying on it.
Choose a pattern in a familiar place using dated, suitable maps and observations, or use this invented case. A north-up island sketch has a mountain ridge in its center, a river flowing from the ridge to a southern port, a dry eastern plain, and a road linking a western valley to the port. A 20-year rainfall record gives the valley about 900 mm annually and the eastern plain about 250 mm. Maps from year 1 and year 10 show houses increasing near the western road after a bridge opened in year 4; the port and western farms trade food. Homes near the river occupy low ground, while others stand on higher terraces. These are supplied classroom observations, not a survey you performed.
Create an annotated map or tactile model, with a text description, that communicates the pattern. For the invented case, positions are approximate: label it a schematic, not a distance map. For your own place, give scale or scale limits, orientation, a key, source dates and boundaries. Write or record an explanation connecting a physical process, such as water movement, with a human decision, such as constructing a bridge. Use at least two distinct pieces of evidence. Explain an effect on people and an uncertainty: do not assume that every riverside household has equal flood exposure or support.
For the invented case, a reasonable starting claim is that western settlement has both water and transport advantages. The rainfall record helps explain farming conditions; the road and bridge offer a connection to the port. A claim that rainfall alone explains the increase after year 4 is incomplete because it ignores the timing of the bridge. But we cannot yet prove the bridge caused every move: new employment, land prices or family ties might also matter. Dated household interviews or job records could help distinguish these possibilities. Your task is to develop and test your own explanation, not copy this starting claim. Consider a change: if the bridge closes, which connection is lost, what alternative route or service would need checking, and who might be affected most? Ask a human reader for one objection, revise your explanation, and explain the revision.
A human reviewer scores each row 0 (missing or misleading), 1 (partly supported; a named correction is needed), or 2 (accurate, connected and justified). Representation: the map or model matches the evidence, includes orientation and key, and states scale limits and dates. Physical reasoning: water, landforms or climate are linked by an explained process, not just named. Human reasoning: settlement, transport or resource decisions help explain the pattern without claiming climate determines everyone. Evidence and alternatives: at least two distinct observations support the claim; an alternative and a useful missing source are identified; association is not called proof. Consequences and transfer: a changed bridge or other condition is evaluated with unequal effects and uncertainty. Revision and communication: the learner records the reader's objection and a reasoned change. All rows must earn 2 before the reviewer calls the task ready; revise lower rows. Record the reviewer's name, date and comments with the work. Automatic item scores do not certify this original explanation, actual fieldwork or human approval.
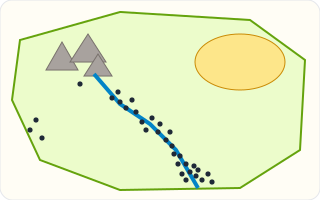
On this invented island, the dots crowd along the river and at its mouth, and none lie on the desert. This is consistent with water access influencing settlement, but does not prove a cause or show that nobody could live there. The mountains have very few dots too, but they are steep and cold as well as dry, so they cannot tell you which of those reasons matters. Good evidence is evidence that fits one explanation better than the others.
| Kind of evidence | Iceland examples |
|---|---|
| Physical | glaciers in the middle, flat coastal land, a warm ocean current |
| Human | the capital, the main airport, the biggest port, most jobs |
Alaska is the largest state in the country, yet about four out of every ten Alaskans live in Anchorage alone, and more than half live in and around it. Huge areas of the interior and the north have almost nobody.
The evidence looks a lot like Iceland's. Physical: much of Alaska is mountains, frozen ground and long, dark winters, while Anchorage sits on flat land by an ocean inlet with milder weather. Human: Anchorage has the state's main airport, its biggest port, military bases and most of its jobs.
It is easy to slip into explaining a pattern with itself: people live in Reykjavik because that is where people live. That sentence only repeats the pattern.
Evidence has to be something else about the place, something you could measure or observe separately, such as the land, the climate, the jobs or the roads. If the evidence and the pattern are the same fact, you have not explained anything yet.
Evidence comes in several forms. A fact can be observed: the airport is in the southwest. A measurement gives a number: about 64 out of every 100 Icelanders live in the capital region. A map shows where things are.
A guess is different. People live there because they like the view may be true for some people, but until somebody asks them or measures it, it is not evidence. Guesses are fine as starting points, as long as they get checked.
Words like most, many and few are hard to check. Is most six out of ten, or nine? Turning a word into a number out of every hundred makes the claim clear, and lets somebody else check it.
Divide the part by the whole and multiply by a hundred. If 240 thousand of a country's 400 thousand people live in its capital region, then 240 divided by 400 is 0.6, and 0.6 times 100 is 60: sixty out of every hundred.
Good evidence is about exactly what the claim is about. To test most earthquakes happen at plate boundaries, you need a map of earthquakes and a map of the boundaries, not a rainfall chart.
Ask: what would I expect to see if the claim were true? What would I see if it were false? Then look for that. Evidence that could come out either way is the most useful kind.
Towns with more ice cream shops have more drownings in summer. Do ice cream shops cause drownings? No: hot weather brings both more ice cream and more swimming.
When two things rise or fall together, that is a correlation. It may mean one causes the other, or that a third thing causes both, or that it is chance. A geographer looks for the third thing before deciding.
An explanation that fits most of the evidence still has to face the rest. In Iceland, Akureyri in the north is a fair-sized town far from the capital. Does it break the explanation? No: it is on flat coastal land with a good harbor, so it fits.
Sometimes a case does not fit, and that is useful too. It shows the explanation needs another piece, or that a better explanation exists.
Checking an answer. A good explanation uses evidence that is separate from the pattern, and it survives the cases that might not fit.
Describing before explaining is needed, because you cannot explain something you have not pinned down. Gathering both kinds of evidence is needed because most patterns have physical and human causes working together.
Checking is allowed, and required, because an explanation is only a suggestion until it is tested. Dividing a part by the whole and multiplying by a hundred is allowed because it compares any part to any whole on the same scale.
The most common slip is accepting a familiar or confident story without checking it. Another is using the pattern as its own evidence.
A third is reading a correlation as a cause. A fourth is using only one kind of evidence, physical or human, when most patterns need both.
Every ten years the U.S. Census Bureau counts everybody in the country. From the count it works out the center of population: the point where the country would balance if every person weighed the same.
In 1790 that point was on Maryland's Eastern Shore. In every census since, it has moved west, and lately south too; by 2020 it was in southern Missouri. That is a pattern, described with a measurement anyone can check.
Geographers then ask why. The evidence includes new land opened to settlers in the 1800s, railroads, and later air conditioning and jobs moving to the South and West. Each piece of evidence can be checked against its own records, such as railroad maps or the dates air conditioning spread. The census does not give the explanation; it gives the pattern and the evidence that an explanation must fit.
In 1854 cholera killed hundreds of people in a few weeks in one London neighborhood. Many people blamed bad air. A doctor named John Snow did something different: he marked each death on a street map.
The marks clustered around one water pump on Broad Street. That was the pattern. Snow then gathered more evidence: workers at a nearby brewery, who drank beer instead of pump water, mostly stayed well, and a woman who lived far away but had water fetched from that pump fell ill. Those cases, which seemed not to fit at first, fit his explanation perfectly.
The pump's handle was removed. Snow's map is still used to teach the same method as this lesson: see the pattern, gather evidence, suggest an explanation, and check it against the cases that might not fit. Today public health workers in the United States map outbreaks the same way.
A familiar story settles a pattern without evidence. A story can be memorable, confident and told by somebody local, and still be wrong. Check it against the evidence.
The pattern is its own evidence. Most people live in the southwest describes what needs explaining; it cannot also be the reason.
If two things rise together, one causes the other. Towns with more fire stations have more fires, because bigger towns have more of both.
Evidence: Anchorage has Alaska's main airport. Read it.
$\text{the main airport is in Anchorage}$
A fact about the place.
Decide whether nature or people made it.
$\text{people}$
Airports are built.
Label the evidence.
$\text{human evidence}$
Made by people.
Say what it could explain.
$\text{why people and jobs gather there}$
Part of the explanation.
Towns with more shops also have more traffic jams. Read the pattern.
$\text{more shops, more jams}$
Two things rise together.
Ask whether shops cause jams.
$\text{not shown yet}$
A correlation only.
Look for something bigger towns have.
$\text{more people}$
They need shops and drive cars.
Name the third cause.
$\text{town size}$
It drives both.
State the result.
$\text{a causal link is not established}$
Correlation alone cannot establish or rule out a causal link.
See: $240$ thousand of a country's $400$ thousand people live in the capital region.
$\dfrac{240}{400} \times 100 = 60$
Sixty out of every hundred.
Ask why it happens.
$\text{why so many in the capital?}$
The question.
Gather physical evidence.
$\text{flat coast, mild climate}$
Easy land.
Gather human evidence.
$\text{government, port, jobs}$
Work and services.
Suggest an explanation.
$\text{easy land plus work}$
Fits both kinds.
Check what might not fit.
$\text{other coastal towns with ports}$
They fit too.
See the pattern.
$\text{big cities on narrow coastal plains}$
Where people crowd.
Gather the evidence.
Suggest and check.
Put the steps a geographer follows to explain a pattern in order.
Number the steps in order (write the number in the box):
Complete the worked solution: an invented country has $300$ thousand people, and $210$ thousand of them live in the capital region. Find how many live outside it, and how many out of every hundred live in the capital region.
Find the people outside the capital region.
$\text{whole country} - \text{capital region} =$ o
Thousands of people.
Find the number out of every hundred.
$\dfrac{\text{capital region}}{\text{whole country}} \times \text{a hundred} =$ p
A share anyone can check.
Say what the number does.
$\text{turns \lq\lq most\rq\rq\ into evidence}$
A measured fact, not a feeling.
On a boat trip in Egypt, a guide says confidently: *nearly everybody lives beside the Nile because Egyptians have always loved boats.* What should a geographer do with this explanation first?
A learner has written about where people live in Iceland. Select **every** sentence that gives evidence that could help explain the pattern.
This task has no paper form; do it on a device.
Match each claim from this course to the evidence that would test it.
| how much river water reached the sea, year by year | a map of earthquakes laid over a map of plate boundaries | population counts from fifty years ago and from today | rainfall measured at places at different latitudes | |
|---|---|---|---|---|
| most earthquakes happen at plate boundaries | ||||
| hot deserts lie around 20 to 30 degrees north and south | ||||
| the Aral Sea shrank because its rivers were used for cotton | ||||
| more people live in cities now than fifty years ago |
A learner looks at a map of the towns in one county and notices that the towns with more fire stations also have more fires each year. They say: *fire stations must cause fires.* What is the best reply?
On this invented island each dot stands for the same number of people; the gray triangles are mountains, the yellow patch is desert and the blue line is a river. A learner claims: *people here avoid land that has no water.* Click the part of the island that is the best evidence **for** that claim.
This task has no paper form; do it on a device.
Here is the evidence for why most Icelanders live in the southwest. Label each piece physical or human.
| Physical or human? | |
|---|---|
| glaciers cover much of the middle of the country | |
| the parliament and government offices are in Reykjavik | |
| a warm ocean current keeps the southwest coast milder | |
| the country's main airport is in the southwest | |
| there is flat land near the coast | |
| most jobs in offices and shops are in the capital region |
In 2024 Iceland had about $390000$ people, and about $250000$ of them lived in the capital region around Reykjavik. To the nearest whole number, about how many out of every $100$ Icelanders lived in the capital region?
Answer:
Read the invented route-and-resource map and its full text equivalent: the northwest and northeast sites are in the same forest belt with the same rainfall and timber potential. A road links the northwest site to the southern port; no road links the northeast site. Houses increased at the northwest site during the 5 years after the road opened; the northeast site stayed small. One explanation says climate alone caused the difference. Another says access to port jobs and timber buyers contributed. Read the field-note analysis below. Select the shared-condition observation that challenges the climate-only explanation, the access/timing evidence, AND the causal limitation. Leave unsupported claims unmarked.
This task has no paper form; do it on a device.
Lesson test: one question per skill, one attempt each, no hints. Your answers are checked when you submit.
In an invented district's dated settlement count, 120 of 300 households live along the river. How many out of every 100 households is that? Report the number; this measures the pattern, not its cause.
Answer:
You can explain a place pattern with evidence. Tell somebody the five steps, and why a confident story is not yet an explanation. That is the whole course in one habit: see the pattern, then find out why.
26. Your turn: why are Japan's cities on the coast?, step 2
$\text{steep mountains inland; flat coast and ports}$
Physical and human.
26. Your turn: why are Japan's cities on the coast?, step 3
$\text{flat land and easy trade}$
It fits both kinds.