Back to the on-screen lesson ·
Why the world's people are spread so unevenly, how to measure crowding with population density, and the physical and human reasons behind the pattern.
Paper packet. Every task here also exists on screen, where it is checked automatically; answers written on paper are not assessed by Nydus. When you are back at a device, enter your answers there.
You will describe where people live on a map, work out and compare population densities, and explain a real population pattern with physical and human factors.
You know the world's biomes and where the deserts, forests and frozen lands lie. Now add people. Some biomes are crowded with them and some are almost empty, and the first job is to see the pattern before explaining it.
| Term | What it means |
|---|---|
| Population distribution | How people are spread out across an area. |
| Population density | How crowded a place is: people for each square mile or square kilometer. |
| Physical factor | Something from nature, such as water, soil, land or climate. |
| Human factor | Something people built or decided, such as jobs, roads or government. |
| Census | A count of every person living in a country, taken every ten years in the United States. |
| Sparse | Thinly spread, with few people over a large area. |
Start with the map, not with the reasons. More than 8 billion people live on Earth, but not evenly. Huge crowds live in river valleys and along coasts, in eastern China, northern India and Bangladesh, and western Europe, while deserts, high mountains, thick forests and frozen lands are almost empty.
To compare places fairly, geographers use population density: people divided by area. A big country with many people may still be less crowded than a small one with fewer.
Then the reasons. Physical factors such as fresh water, flat land, fertile soil and a bearable climate make a place easier to live in. Human factors such as jobs, ports, roads and railways, and a long history of settlement draw people too, sometimes to places nature makes hard.
Another way: steps
To work out a density: 1. Find the number of people. 2. Find the area in square miles. 3. Divide people by area. 4. Say what it means: so many people, on average, in each square mile.
Another way: diagram
Imagine two playgrounds the same size. Put 10 children in one and 100 in the other. The second is ten times as crowded, and its density is ten times as big. Density is simply how crowded, measured fairly.
Density divides a population by its land area. A map that makes high-latitude land look enlarged can mislead a visual comparison of how much land people occupy. For area comparisons, choose an equal-area representation and read its scale; a transit diagram is designed for connections, not measuring land. For locating houses along a lane, use a detailed local map instead of a world map. Check whether the population count and boundaries refer to the same year. Even a good projection cannot repair mismatched data.
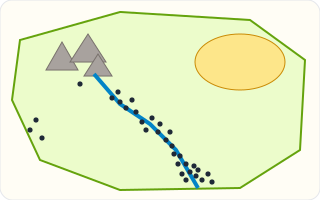
On this invented island, each dot is the same number of people. The dots crowd along the river and thickest of all where it meets the sea. The desert has none and the mountains hardly any.
| Country | People per km², about 2023 |
|---|---|
| Singapore | about 8,000 |
| Bangladesh | about 1,100 |
| United Kingdom | about 280 |
| Australia | about 3 |
The real figures in this course are rounded and say about, and each one belongs to a period or a year. Populations grow, rivers change course and coasts wear back, so a number is always a number for a time.
The 2020 census counted about $331$ million people in the United States, an average of about $94$ people per square mile. But the average hides huge differences between states.
| State | People per square mile, 2020 |
|---|---|
| New Jersey | about 1,260 |
| Massachusetts | about 900 |
| Wyoming | about 6 |
| Alaska | about 1 |
Americans usually measure land in square miles; most other countries use square kilometers. A square mile is about $2.6$ square kilometers, so a density per square mile is about $2.6$ times the same density per square kilometer.
The United States' $94$ people per square mile is about $36$ per square kilometer, which is why the world table gives it about $35$. Always check the unit before comparing two densities.
Nearly every great early city grew beside a river or a coast: water to drink, water for crops, and a way to move goods by boat. Egypt's people crowd along the Nile; America's first big cities grew on harbors and rivers.
In the dry West, water still decides where people can live. Cities such as Phoenix and Las Vegas depend on rivers carried from far away by canals and pipelines.
Flat land is easy to farm, build on and cross. River valleys and coastal plains combine flat land with rich soil, which is why they often hold the most people.
The fertile plains of the Midwest drew farming families in the 1800s. Steep mountains, like the Rockies' high peaks, hold far fewer people, because farming and building are hard there.
Very cold, very dry and very hot places tend to have few people. Canada's far north, the Sahara and the interior of Australia are almost empty.
But climate is not the whole story. Jobs, trade and resources can draw people to places nature makes hard, from Singapore's steamy port to Norilsk's frozen mines to the air-conditioned cities of the American Southwest.
People move to where the work is. Factories, ports, offices and universities draw crowds; so do capital cities, where government offices cluster.
Transport shapes the map too. Railroads built towns across the Great Plains, each one at a stop along the line, and interstate highways later let suburbs spread far from city centers.
Checking an answer. Multiply the density by the area and you should get the number of people back. A density can be small even for a huge population, if the land is huge too.
Dividing people by area gives the people in each unit of land, which is exactly what crowding means. It lets a small place and a big place be compared on the same scale.
An average density describes the whole area as if people were spread evenly, which they never are. So a careful geographer uses it to compare places, then looks at a map to see where the people actually live within them.
Egypt's average density is about $110$ people per km², but its desert is nearly empty and the Nile valley is packed. Australia's average of about $3$ hides crowded coastal cities such as Sydney and Melbourne.
Alaska's average is about one person per square mile, yet about four in ten Alaskans live in and around Anchorage. A density is a starting point, not the whole picture.
Every ten years, as the Constitution requires, the Census Bureau counts every person living in the United States. The count decides how many seats each state gets in the House of Representatives and how federal money is shared.
Census results are published down to small neighborhoods called census blocks, so geographers can map density street by street and see how crowding changes from one side of a town to the other.
The most common slip is dividing area by people instead of people by area. Another is thinking a big population means a crowded country, when the area matters just as much.
A third is comparing a density per square mile with one per square kilometer. A fourth is thinking people live only where the climate is mild, when jobs and resources draw people to hard places too.
Las Vegas, Nevada, sits in the Mojave Desert, which gets only about four inches of rain a year. By the physical factors alone, it should be nearly empty. Yet more than two million people live in the Las Vegas area, and it was one of the fastest-growing metropolitan areas in the country for decades.
Human factors explain it. Hoover Dam, finished in 1936, created Lake Mead on the Colorado River, which now supplies most of the region's water. Hotels, casinos and conventions created jobs, and air conditioning made the hot summers bearable.
The city's growth also shows the limits of human factors. As drought has lowered Lake Mead, Las Vegas has paid homeowners to tear out lawns and recycles almost all its indoor water. A desert city can thrive, but only by managing the physical factor it lacks.
After every census, the Census Bureau calculates the United States' mean center of population: the point where a flat map of the country would balance if every person weighed the same. It shows, in a single dot, where Americans live.
In 1790 the center was on Maryland's Eastern Shore, east of Baltimore, because nearly everyone lived along the East Coast. Since then it has moved steadily west and, more recently, south, as people settled the Midwest, the West Coast and the Sun Belt. After the 2020 census it was near the town of Hartville, in southern Missouri.
The moving dot sums up two centuries of population change. Its westward march follows farming, railroads and gold rushes; its turn south follows jobs, air conditioning and retirees moving to warmer states. The same factors that explain a density map explain why the center keeps moving.
People live only where the climate is mild. Singapore is hot and humid, and Norilsk in Siberia is bitterly cold, and both have many people because of the work there.
A big population means a crowded country. The United States has far more people than the Netherlands, but the Netherlands is more than ten times as crowded. Use density.
A country's density describes every part of it. Egypt's average is about 110 people per km², but the desert is nearly empty and the Nile valley is packed.
A district of $40$ square miles has $1200$ people. Record the people.
$1200$
The top of the fraction.
Record the area.
$40\ \text{square miles}$
The bottom.
Divide people by area.
$1200 \div 40 = 30$
People per square mile.
Check by multiplying back.
$30 \times 40 = 1200$
Gives the people.
Australia is about $7.7$ million km². Record the area.
$7.7\ \text{million km}^2$
A huge country.
About $27$ million people live there. Record the people.
$27\ \text{million}$
Not many for the area.
Divide people by area.
$27 \div 7.7 \approx 3.5$
About 3 per km².
Name why the middle is empty.
$\text{hot desert, little water}$
A physical factor.
Say where the people are.
$\text{coastal cities in the southeast}$
The average hides the pattern.
New Jersey has about $9.3$ million people on about $7400$ square miles. Find its density.
$9300000 \div 7400 \approx 1260$
People per square mile.
Wyoming has about $577000$ people on about $97000$ square miles. Find its density.
$577000 \div 97000 \approx 6$
People per square mile.
Compare the two.
$1260 \div 6 = 210$
About 210 times as crowded.
Name a human factor for New Jersey.
$\text{jobs near New York and Philadelphia}$
Two great cities next door.
Name a physical factor for Wyoming.
$\text{high, dry, cold plains and mountains}$
Hard to farm.
State the conclusion.
$\text{density shows what a head count cannot}$
Area matters.
Record the people and area.
$3000 \text{ people},\ 20\ \text{square miles}$
The two figures.
Divide people by area.
Evaluate the density.
Egypt has more than 100 million people, and about 95 of every 100 of them live on the narrow strip of land along the Nile and in its delta, which is only about one twentieth of the country. What is the main reason?
Complete the worked solution: a city county has $240000$ people on $400$ square miles, and a rural county has $30000$ people on $750$ square miles. Find each county's population density, and how many times as crowded the city county is.
Find the city county's density.
$\dfrac{\text{people}}{\text{square miles}} =$ d
People per square mile.
Find the rural county's density.
$\dfrac{\text{people}}{\text{square miles}} =$ e
The same rule.
Divide the bigger density by the smaller.
$\dfrac{\text{city}}{\text{rural}} =$ r
Times as crowded.
Say why density beats a head count.
$\text{it allows for the land}$
Big counties hold many people even when thinly spread.
Singapore is hot and sticky all year, yet it is one of the most crowded places on Earth. Norilsk, a city of about 175,000 people in Siberia, has January temperatures of around $-27$ °C, and it grew up around huge mines for nickel and other metals. What do these two places show?
Rounded population densities for about 2023, in people per km²: Australia about 3, Bangladesh about 1,100, the Netherlands about 500, Singapore about 8,000, the United Kingdom about 280 and the United States about 35. Put them in order from most crowded to least crowded.
Number the steps in order (write the number in the box):
Match each real population pattern to its main reason.
| a busy port and many jobs on a small island | long, bitter winters and frozen ground | water and farmland in the middle of a desert | steep slopes and thin, cold air | |
|---|---|---|---|---|
| the crowded Nile valley in Egypt | ||||
| the almost empty high Himalayas | ||||
| crowded Singapore | ||||
| Canada's almost empty far north |
On this invented island each dark dot stands for the same number of people. The gray triangles are mountains, the yellow patch is desert and the blue line is a river. Click the part of the island where people are **most** crowded.
This task has no paper form; do it on a device.
Three districts in an invented country. Work out each one's population density, in people per square mile.
| People per square mile | |
|---|---|
| mountain district: 105 people on 35 square miles | |
| farming district: 627 people on 11 square miles | |
| port district: 2248 people on 8 square miles |
Each of these can attract people to a place. Say whether it is a physical factor or a human factor.
| Physical or human? | |
|---|---|
| fertile soil | |
| jobs in factories and offices | |
| flat land | |
| a railway line | |
| a supply of fresh water | |
| government offices in a capital city |
A district covers $90$ square miles and $1620$ people live in it. What is its population density, in people per square mile?
Answer:
An unfamiliar island council has 5 coastal districts and wants to compare how much land each occupies before using population counts to calculate density. It offers a Mercator map, an equal-area map, and a transit diagram whose spacing was stretched to fit station names. Which representation best supports the land-area comparison?
Lesson test: one question per skill, one attempt each, no hints. Your answers are checked when you submit.
A district covers $67$ square miles and $3685$ people live in it. What is its population density, in people per square mile?
Answer:
You can measure and explain crowding. Tell somebody why most Egyptians live beside the Nile, and why Singapore is crowded although its climate is not mild. Next: how a settlement starts in one place and grows.
24. Your turn: a small island, step 2
$3000 \div 20$
Density.
24. Your turn: a small island, step 3
$150$
People per square mile.