Back to the on-screen lesson ·
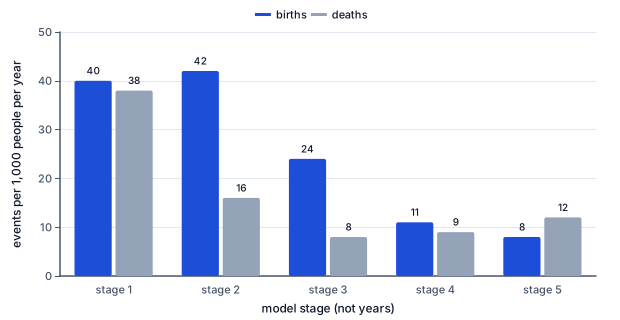
Death rates fall first and birth rates follow, so growth is fastest in the middle stages; the level of the rates, not only their gap, places a country in a stage.
Paper packet. Every task here also exists on screen, where it is checked automatically; answers written on paper are not assessed by Nydus. When you are back at a device, enter your answers there.
By the end of this lesson you will be able to place a country in a stage of the demographic transition from its rates, and say what the model assumes.
You can find a natural increase from births and deaths, turn a rate per thousand into a percent, and estimate a doubling time. This lesson uses those rates to follow how a country's growth changes over a century or more, and why the fastest growth comes in the middle of that story rather than at its start or end.
| Term | What it means |
|---|---|
| Demographic transition model | A description of how birth and death rates changed as countries industrialized, in four or five stages. |
| Crude birth rate | Births in a year per thousand people. |
| Crude death rate | Deaths in a year per thousand people. |
| Total fertility rate | The average number of children a woman would have at current rates. |
| Replacement level | A total fertility rate of about $2.1$, which keeps a population steady in the long run without migration. |
| Dependency ratio | Children under 15 and adults 65 and over for every hundred people aged 15 to 64. |
| Population pyramid | A pair of bar charts showing the population by age group, males on one side and females on the other. |
The model follows two rates through time:
$$\text{natural increase} = \text{birth rate} - \text{death rate}.$$
The level of the rates, not only the gap, tells the stage.
Another way: picture
Picture two lines on a long timeline. The death-rate line drops first, like a door swinging open; the birth-rate line follows a generation later, closing the door again. The width of the open door between them is the population's growth, and it is widest in the middle of the story.
Another way: steps
Horizontal positions are model stages, not equal time intervals or dates. Read the vertical gap between birth and death rates for natural increase. Early high-rate and later low-rate examples can have the same small gap. Where deaths exceed births there is natural decrease, but migration could still make total population grow. Connecting lines summarize a model, not a country's fixed schedule. A single year's rates cannot establish whether rates are falling: that needs a dated series and attention to crises and changes in age structure.
The model was built in the first half of the twentieth century by demographers such as Warren Thompson and Frank Notestein, who studied how the populations of England, France and other Western European countries had changed since the 1700s.
It is a description of what happened there, turned into a sequence of stages. That origin matters, because a model drawn from a few countries' histories may not fit a country whose history is different, and geographers use it as a comparison, not a timetable.
Before modern medicine and a secure food supply, both rates were high, often above thirty per thousand. Many children died young, famine and disease struck often, and families had many children partly because so many did not survive.
Births and deaths roughly balanced, so the population grew slowly or not at all. Treat this as a historical model pattern rather than a label for a present-day population. A single year's high rates could also reflect a temporary crisis.
In stage 2 the death rate falls sharply while the birth rate stays high. Clean water, sewers, better food and later vaccines save lives, especially the lives of infants and young children.
Births do not fall at once, because the number of children families expect and want changes slowly. The gap between the rates opens, and the population grows fast, often by more than two percent a year.
In stage 3 the birth rate falls toward the lower death rate. When most children survive, families need fewer to be sure of some surviving. As people move to cities, children cost more to raise and earn less for the family.
Schooling for girls, jobs for women outside the home and access to contraception all push the birth rate down. The gap narrows and growth slows, though the population is still rising.
In stage 4 both rates are low, often around ten per thousand, and close together. Growth is slow again, as in stage 1, but for the opposite reason: people live long lives and have small families.
For a constructed example, birth and death rates of $11$ and $9$ per thousand resemble the model's fourth stage: natural increase is $0.2$ percent. These are illustrative rates, not a current country classification or a forecast.
The original model stopped at stage 4. Later geographers added a fifth stage for countries where the birth rate has fallen below the death rate, so the population shrinks unless migration makes up the difference.
A constructed population with persistent birth and death rates of $7$ and $11$ per thousand resembles this extension. A single year's negative balance is insufficient: a temporary mortality shock can produce the same arithmetic.
A natural increase of two per thousand fits both stage 1 and stage 4. In the first the rates might be $40$ and $38$; in the second, $11$ and $9$. The gap is the same, but the two countries could hardly be more different.
So always read the level of the rates as well as their difference. High and close is stage 1, low and close is stage 4, and deaths above births is stage 5.
The crude birth rate depends on how many people are of an age to have children. The total fertility rate avoids that problem: it is the average number of children a woman would have in her life at today's rates.
A total fertility rate of about $2.1$ is called replacement level, because it replaces two parents and allows for some children not surviving in a low-mortality population. Replacement fertility varies with survival and sex ratios; $2.1$ is not universal.
A population pyramid shows the age structure. In stages 1 and 2 it has a wide base and narrows quickly, because there are many children and few old people. In stage 3 the base begins to narrow.
In stage 4 the pyramid looks more like a column, with similar numbers at each age until late in life. In stage 5 it is narrower at the bottom than in the middle, a sign of fewer births than a generation ago.
Checking an answer. Compare the rate history, not just the gap. Fast natural increase can resemble stages 2 or 3; persistent low births below deaths can resemble stage 5. Neither comparison diagnoses causes or sets a timetable.
The natural increase is the birth rate minus the death rate by definition, so the gap between the lines is the growth from births and deaths alone.
Naming a stage is a comparison with the pattern the model describes, not a measurement. It is allowed as long as we say so: the country's rates resemble those of a stage, which suggests, but does not prove, that it shares the causes the model gives for that stage.
A population keeps growing for decades after fertility falls to replacement level. The children born in stage 2 grow up and have children of their own, even if each family is small, because there are so many young parents.
This is called population momentum. A constructed population with many young adults can keep growing even after fertility reaches replacement. Its age structure matters alongside the current fertility rate and migration balance.
The model ignores migration, which can matter more than births and deaths for a country's growth. It says nothing about how long each stage lasts: Europe took more than a century to pass through stage 2, while some Asian countries took a few decades.
It also assumes that falling death rates come from industrialization. In many countries death rates fell because of imported medicines and vaccines, before industry grew, so the causes behind a stage may differ from Europe's.
The honest way to use the model is as a conditional statement. If death rates fall while birth rates stay high, growth will speed up; if birth rates then fall, it will slow. Each part holds only while its condition holds.
Stated that way, the model makes a checkable claim about a country's rates instead of a prediction about its future. A geographer compares the country with the model, notes where it fits and where it does not, and looks for the reasons.
As a country moves through the stages, its dependents change. In stage 2 most dependents are children; in stages 4 and 5 more of them are older adults.
The dependency ratio counts children under 15 and adults 65 and over for every hundred people aged 15 to 64. A ratio of $60$ means sixty dependents for every hundred people of working age, whose taxes and work support schools, pensions and health care.
The most common slip is naming a stage from the gap alone and so confusing stage 1 with stage 4. Another is thinking that birth rates fall first; in the model deaths fall first, and births follow.
A third is treating the model as a prediction that every country must reach stage 4 or 5 on a fixed schedule. A fourth is forgetting that a crude rate depends on the age structure, so an old country can have a high crude death rate even with good health care.
The United States passed through the middle stages of the transition between the late 1800s and the late 1900s. Death rates fell as cities built clean water supplies and sewers; Jersey City, New Jersey, began continuously chlorinating its drinking water in 1908, and other cities soon followed. Deaths of infants and young children from waterborne disease dropped sharply.
Birth rates fell more slowly, then rose again after World War II in the baby boom, when the crude birth rate climbed back to about $25$ per thousand in the 1950s. That bump does not fit the model's smooth lines, and it is a reminder that the model describes a trend, not every decade.
Do not turn that historical outline into a timeless stage label. To classify a particular period, obtain dated birth, death and age-structure records and inspect the preceding trend. Then state that the rates resemble a model stage, retaining the effects of migration and temporary mortality changes. Planners need those details to interpret demand for schools, pensions and health care.
South Korea passed through the transition faster than almost any country. In 1960 its total fertility rate was about six children per woman. As the country industrialized and people moved to cities such as Seoul, fertility fell below replacement by the mid-1980s.
Statistics Korea's 2024 preliminary birth statistics, in its table of annual birth and fertility trends, lists a total fertility rate of $0.72$ for 2023 and $0.75$ for 2024. The small increase is a useful reminder that a model does not dictate an irreversible sequence. Low fertility alone does not measure the birth-death balance; examine mortality and migration too.
The speed matters. Europe had more than a century to adjust its schools, pensions and health care as its population aged; South Korea has had a few decades. The government has spent heavily on child care and housing support to encourage larger families. Evaluating those policies requires dated comparisons and a counterfactual; a low fertility observation alone cannot identify their effect or prove that a model stage is irreversible.
It is natural to name a stage from how fast a population grows. But slow growth happens twice in the model: in stage 1, where both rates are high, and in stage 4, where both are low. A natural increase of two per thousand fits both.
Only the level of the rates separates them. A country with rates of $40$ and $38$ is in a world of short lives and large families; one with $11$ and $9$ is in a world of long lives and small families. Read the level as well as the gap.
A country has a crude birth rate of $36$ and a crude death rate of $9$. Find the natural increase.
$36 - 9 = 27$
Per thousand.
Judge the level of each rate.
$36 \text{ high},\ 9 \text{ low}$
Deaths have fallen; births have not.
Name the stage.
$\text{stage 2}$
The death rate fell first.
Find the growth in percent.
$27 \div 10 = 2.7\%$
Fast growth, as stage 2 predicts.
Country A has rates of $39$ and $37$ per thousand. Find its natural increase.
$39 - 37 = 2$
A small gap.
Country B has rates of $10$ and $8$. Find its natural increase.
$10 - 8 = 2$
The same gap.
Judge the levels of the two pairs.
$\text{A high},\ \text{B low}$
Opposite ends of the transition.
Name both stages.
$\text{A: stage 1},\ \text{B: stage 4}$
Level decides.
Explain what differs in daily life.
$\text{A: short lives, large families};\ \text{B: long lives, small families}$
Same growth, different causes.
In 1900 a country's rates are $38$ and $30$. Find the natural increase.
$38 - 30 = 8$
Slow growth.
By 1950 the death rate is $12$ and the birth rate $36$. Find the natural increase.
$36 - 12 = 24$
Deaths fell first.
By 2000 the rates are $14$ and $7$. Find the natural increase.
$14 - 7 = 7$
Births followed.
Name the stage in each year.
$1900{:}\ 1,\ 1950{:}\ 2,\ 2000{:}\ 3 \text{ to } 4$
Level and gap together.
Find the fastest growth in percent.
$24 \div 10 = 2.4\%$
In the middle of the story.
State the model's condition.
$\text{if births fall after deaths}$
A comparison, not a law.
Find the natural increase.
$9 - 11 = -2$
More deaths than births.
Judge the level of the rates.
$\text{both low}$
A late stage.
Name the stage.
A country has a crude birth rate of $40$ and a crude death rate of $38$, both per thousand people. In which stage of the demographic transition model does it fit best?
Complete the worked solution: a country's birth rate stays at $40$ per thousand while clean water and vaccines cut its death rate from $31$ to $15$ per thousand. Find the natural increase per thousand before and after, and the growth after in percent a year.
Find the natural increase before the fall.
$40 - 31 =$ a
Birth rate minus the old death rate.
Find the natural increase after the fall.
$40 - 15 =$ c
Birth rate minus the new death rate.
Turn the new increase into a percent.
$\text{per thousand} \div 10 =$ r
Growth a year.
Name the stage this describes.
$\text{stage 2: deaths fall first}$
Births have not yet followed.
Match each stage of the demographic transition model to its description.
| high birth and death rates, slow growth | the death rate falls while the birth rate stays high | the birth rate falls toward a low death rate | low birth and death rates, slow growth | |
|---|---|---|---|---|
| stage 1 | ||||
| stage 2 | ||||
| stage 3 | ||||
| stage 4 |
A country has a crude birth rate of $40$ and a crude death rate of $38$ per thousand. Fill in its natural increase per thousand, its growth in percent a year, and the number of its stage in the demographic transition model.
| value | |
|---|---|
| natural increase (per thousand) | |
| growth (percent a year) | |
| stage (1 to 5) |
A country's crude birth rate stays at $24$ per thousand while its death rate, $d$ per thousand, changes. Write its natural increase per thousand as a function of $d$.
Answer:
A country of $50$ million people has a crude birth rate of $20$ and a crude death rate of $8$ per thousand, and no net migration. About how many thousand people does it add in a year?
Answer: thousand people
Suppose a county in Maine has $9000$ children under 15, $12000$ adults aged 65 or over, and $35000$ people aged 15 to 64. What is its dependency ratio, the dependents for every hundred people of working age?
Answer: per 100
Lesson test: one question per skill, one attempt each, no hints. Your answers are checked when you submit.
A country's crude birth rate stays at $40$ per thousand while its death rate, $d$ per thousand, changes. Write its natural increase per thousand as a function of $d$.
Answer:
You can use the demographic transition model. Explain why two countries growing at the same slow rate can be in opposite stages.
28. Your turn: a country has a crude birth rate of $9$ and a crude death rate of $11$ per thousand. In which stage does it fit?, step 3
$\text{stage 5}$
Deaths above births.