Back to the on-screen lesson ·
Income per person, life expectancy, schooling and the Human Development Index each measure part of development, and each leaves something out.
Paper packet. Every task here also exists on screen, where it is checked automatically; answers written on paper are not assessed by Nydus. When you are back at a device, enter your answers there.
By the end of this lesson you will be able to compute and compare development measures, build an index, and name what each measure leaves out.
You can find a percent, divide a total by a population, and read the share of workers in each economic sector. This lesson asks what it means for a country to be more or less developed, and why every way of measuring it leaves something out.
| Term | What it means |
|---|---|
| Development | Improvement in people's lives: income, health, education and the freedom to choose how to live. |
| Gross national income | The total income earned by a country's residents in a year, including income from abroad. |
| Income per person | Gross national income divided by the population. |
| Human Development Index | A United Nations index from $0$ to $1$ combining health, education and income. |
| Life expectancy | The average years a newborn would live at current death rates. |
| Purchasing power parity | An adjustment that compares incomes by what they can buy at local prices. |
| Development gap | The difference in income or well-being between richer and poorer places. |
Each measure of development sees part of people's lives:
$$\text{income per person} = \dfrac{\text{gross national income}}{\text{population}}.$$
$$\text{index} = \dfrac{\text{value} - \text{min}}{\text{max} - \text{min}},$$
and combines them with a geometric mean. Every measure leaves something out.
Another way: picture
Picture two towns with the same average income. In one, most families earn close to the average; in the other, a few families earn a great deal and most earn little. The average is identical, but life in the two towns is not. Every single measure is an average like this one.
Another way: steps
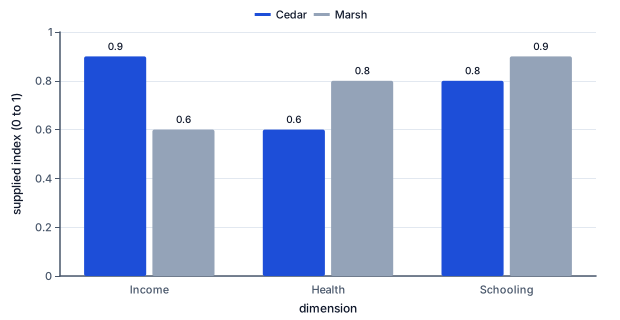
| Supplied dimension index | Cedar | Marsh |
|---|---|---|
| Income | 0.9 | 0.6 |
| Health | 0.6 | 0.8 |
| Schooling | 0.8 | 0.9 |
These invented dimension indices share a zero-to-one scale and a common reference period. They are not raw incomes, percentages, measured country statistics or official overall HDI scores. Compare bars within each dimension: Cedar leads on income; Marsh leads on health and schooling. No place leads on every measure. Combining them requires an explicit aggregation rule and a reason for using it. Even a combined score leaves within-place inequality and omitted dimensions unresolved. Ask which people benefit before treating the taller income bar as a complete account of development.
Compare indicators using their definitions before combining them. Income describes purchasing resources, school attendance describes participation, and life expectancy summarizes mortality conditions. An index combines selected dimensions with weights; it cannot make all aspects of development interchangeable. Environmental damage and unpaid care can be absent from a money measure even though they affect daily life.
In a fictional comparison, Coast has higher average income than Inland but lower school attendance. A claim that Coast is better on every dimension fails immediately. Even a favorable regional average cannot establish that a particular child attends school. Ask for neighborhood or household data and inspect how services are distributed. Use the same reference year where possible; if years differ, report that limitation rather than inventing a trend.
Work a small inequality check: four households earn 10, 10, 10 and 90 units. Their mean is 30, but three households receive only 10. In a second place, four households each earn 30. The mean is identical while the distribution differs sharply. A policy justified only by the means could miss deprivation in the first place. Pair a measure of central tendency with a distribution and a second dimension, and state whose welfare the comparison is intended to describe.
Development is more than getting richer. Most geographers follow the economist Amartya Sen in describing it as people gaining the freedom to live lives they value: to be healthy, to be educated, to earn a decent living and to take part in their community.
That makes development hard to measure, because no single number captures all of it. Every measure is a choice about which part of people's lives to count, and each choice leaves something out.
The most common measure is gross national income per person: the total income of a country's residents divided by its population. The World Bank uses it to sort countries into income groups, with the high-income line at about $14000$ dollars per person a year.
When the income is in billions and the population in millions, the division leaves a factor of one thousand. An income of $500$ billion dollars shared by $25$ million people is $20000$ dollars each.
Income per person is an average, and averages hide how income is shared. A country where a few people earn a great deal can have a high average while most people are poor.
Geographers measure how income is shared with tools such as the Gini coefficient, which runs from zero, where everyone has the same income, to one, where one person has it all. Two countries with the same average can have very different Gini coefficients.
A dollar buys more in some countries than in others. Rent, food and haircuts cost far less in many low-income countries than in the United States, so an income converted at market exchange rates understates how much it buys there.
Purchasing power parity adjusts for this. If prices in a country average $40$ percent of U.S. prices, an income of $12000$ dollars buys what $30000$ dollars would buy in the United States. Comparisons of living standards use these adjusted figures.
Life expectancy at birth measures health: the years a newborn would live if death rates stayed as they are. It rose in the United States to about $77$ years in 2022, according to the National Center for Health Statistics, and ranges from the low $50$s to the mid $80$s across countries.
Education is measured by the years of schooling adults have had and the years a child can expect. Both change slowly, so they describe a country's long-run investment in its people rather than a single year's income.
In 1990 the United Nations Development Programme published the first Human Development Index, designed by the economist Mahbub ul Haq with Amartya Sen. It combines health, education and income into a single number from $0$ to $1$.
Each part is first turned into an index using goalposts: for life expectancy, $20$ and $85$ years. A country at $72$ years scores $(72 - 20)/65 = 0.8$, eight tenths of the way from the lowest goalpost to the highest.
The HDI combines its parts with a geometric mean, the cube root of the product of its three indices, rather than a simple average. With two parts it is the square root of their product.
The geometric mean is never higher than the simple average, and it falls sharply if one part is very low. A country cannot make up for very poor health with high income, which matches the idea that development needs all its parts.
Checking an answer. An index lies between $0$ and $1$. Income per person for a country lies between a few hundred and about a hundred thousand dollars a year.
Dividing a total by the population is allowed because an average per person makes large and small countries comparable. It describes the typical share, not any real person's income.
Turning a measure into an index is allowed because it rescales the measure without changing its order: a country with a longer life expectancy always has a higher index. That lets measures in years and in dollars be combined, which their raw units would not allow.
Countries rank differently on different measures. Some oil-rich countries rank much higher on income per person than on education or health. Some countries with modest incomes rank high on life expectancy, thanks to public health care and healthy diets.
The United States ranks among the highest in the world on income per person but lower on life expectancy than most other rich countries. Comparing ranks on several measures is more revealing than any one rank.
None of these measures counts unpaid work, such as caring for children or elders, which is a large share of the work done in every country. Income measures also miss the informal economy of street vendors and day laborers in many countries.
They also ignore the environment. A country can raise its income by cutting its forests or depleting its groundwater, which counts as growth now but leaves less for the future.
Some measures try to fill these gaps. The inequality-adjusted HDI lowers a country's score according to how unequally health, education and income are shared. Bhutan measures gross national happiness, surveying its people about their lives.
Each alternative makes its own choices about what to count. The right measure depends on the question: comparing incomes, comparing health, or asking how the poorest people in a place are doing.
Development differs within countries as well as between them. Income, life expectancy and schooling vary from state to state and county to county in the United States, with life expectancy several years higher in Hawaii than in Mississippi.
So a development comparison must name its scale. A national average can hide rich cities and poor rural regions, and a regional average can hide rich and poor neighborhoods side by side.
Income figures come from national accounts, compiled by each country and gathered by the World Bank and the United Nations. Life expectancy comes from registered births and deaths, and schooling from censuses and school records.
Countries with weaker statistical systems have less certain figures, and some are estimated from surveys. A careful comparison gives the year and the source of each figure, and treats small differences between countries with caution.
The most common slip is forgetting the factor of a thousand when dividing billions by millions. Another is comparing total incomes, which mostly measure a country's size, instead of incomes per person.
A third is forgetting to subtract the minimum when making an index, which gives a number that is too high. A fourth is treating one measure as the whole story of how well people live, when each measure sees only a part.
A planning team compares two fictional places in the same reference year. Harbor has income of 60000 units per person, life expectancy of 74 years and school attendance of 82 percent. Ridge has income of 45000 units per person, life expectancy of 79 years and attendance of 94 percent. These are constructed teaching data, not estimates for any real country or an official HDI.
Harbor's income is one third higher: the difference of 15000 divided by Ridge's 45000 is one third. Ridge nevertheless leads by five years of life expectancy and twelve percentage points of attendance. None of these differences proves why the outcomes differ; health access, age patterns and school provision need their own evidence.
Before allocating services, the team asks for within-place distributions. A high mean income can coexist with low incomes in some neighborhoods. The comparison therefore retains all three dimensions and requests comparable household data, rather than turning one favorable average into a claim about every resident.
Before 1990, development was usually ranked by income alone. The Pakistani economist Mahbub ul Haq, working with Amartya Sen at the United Nations Development Programme, argued that this confused the means of development with its ends. Income matters because of what it lets people do: live long, learn and choose.
The first Human Development Report, in 1990, ranked countries on a combination of life expectancy, literacy and income. Several countries ranked much higher or lower than their incomes alone would suggest, which drew attention to public health and schooling as parts of development in their own right.
Sen himself warned that the index was a rough measure, deliberately simple so that it would be used. Its value lies partly in the argument it forces: every time a country's income rank and HDI rank differ, someone asks why, and the answer points to what money alone does not buy.
It is natural to reach for a single number, usually income per person, and rank countries by it. But that number is an average of income alone. It says nothing about how the income is shared, what it buys at local prices, or how long and how healthily people live.
Countries rank differently on income, health and education, and each measure leaves out unpaid work and the environment. A careful comparison uses several measures, names the scale and the year, and says what each measure cannot see.
A country's income is $300$ billion dollars. Record it.
$300\ \text{billion}$
The total.
Its population is $20$ million. Record it.
$20\ \text{million}$
The people who share it.
Divide and scale by a thousand.
$\dfrac{300}{20} \times 1000 = 15000$
Dollars per person.
Say what the average leaves out.
$\text{how the income is shared}$
An average hides inequality.
A worker earns $8000$ dollars a year at market exchange rates. Record the income.
$8000$
In dollars.
Local prices are $40$ percent of U.S. prices. Write the fraction.
$0.4$
Of U.S. prices.
Divide the income by the fraction.
$\dfrac{8000}{0.4} = 20000$
What it buys at U.S. prices.
Check the direction of the change.
$20000 > 8000$
Cheaper prices stretch the income.
Name the adjustment.
$\text{purchasing power parity}$
Used in the HDI.
A country's life expectancy is $59$ years. Find its health index.
$\dfrac{59 - 20}{65} = 0.6$
Between the goalposts.
Its expected schooling is $9$ years. Find its education index.
$\dfrac{9}{18} = 0.5$
Between $0$ and $18$ years.
Find the product of the two.
$0.6 \times 0.5 = 0.3$
For the geometric mean.
Take the square root.
$\sqrt{0.3} \approx 0.55$
The combined index.
Compare with the simple average.
$\dfrac{0.6 + 0.5}{2} = 0.55$
Nearly equal when the parts are close.
Say when the two differ most.
$\text{when one part is very low}$
The geometric mean falls further.
Subtract the minimum.
$78.5 - 20 = 58.5$
Distance above the lowest goalpost.
Divide by the range.
$\dfrac{58.5}{65}$
The range is $85 - 20$.
Evaluate the index.
A country's gross national income is $7.5$ billion dollars a year, and it has $5$ million people. What is its gross national income per person?
Complete the worked solution: a country has a life expectancy of $72$ years and an expected $3.6$ years of schooling. Using goalposts of $20$ to $85$ years for health and $0$ to $18$ years for schooling, find the health index, the education index, and their geometric mean, the square root of their product.
Find the health index.
$\dfrac{\text{life expectancy} - 20}{65} =$ a
Between the health goalposts.
Find the education index.
$\dfrac{\text{schooling}}{18} =$ b
Between the schooling goalposts.
Take the geometric mean.
$\sqrt{\text{health} \times \text{education}} =$ g
A low score in one is not fully made up by the other.
Compare it with a simple average.
$\text{never higher than the average}$
The geometric mean rewards balance.
Match each measure to what it captures.
| average income, with nothing about how it is shared | health, as the years a newborn can expect to live | education, as the years a child can expect in school | income, health and education combined in one index | |
|---|---|---|---|---|
| gross national income per person | ||||
| life expectancy at birth | ||||
| expected years of schooling | ||||
| Human Development Index |
Country A has an income of $1200$ billion dollars and $40$ million people. Country B has $60$ billion dollars and $30$ million people. Fill in each country's income per person in dollars, and how many times larger A's is than B's.
| value | |
|---|---|
| A's income per person (dollars) | |
| B's income per person (dollars) | |
| A's figure divided by B's |
A country's gross national income is $7.5$ billion dollars. Write its income per person, in dollars, as a function of its population $p$ in millions.
Answer:
The Human Development Index turns life expectancy into an index using goalposts of $20$ and $85$ years. A country's life expectancy at birth is $59$ years. What is its life expectancy index?
Answer:
Suppose a nurse abroad earns the equivalent of $6000$ dollars a year at market exchange rates, and prices there average $25$ percent of U.S. prices. What income would buy as much in the United States?
Answer: dollars
In a fictional same-year survey, A has mean income 7 units, school attendance 70 percent, and a large gap between its poorest and richest neighborhoods. B has lower mean income, attendance 95 percent, and a smaller gap. Which assessment respects the evidence?
Lesson test: one question per skill, one attempt each, no hints. Your answers are checked when you submit.
A country's gross national income is $500$ billion dollars. Write its income per person, in dollars, as a function of its population $p$ in millions.
Answer:
You can compare development measures. Explain why a country can rank near the top on income and much lower on the Human Development Index.
28. Your turn: a country's life expectancy is $78.5$ years. What is its life expectancy index with goalposts of $20$ and $85$ years?, step 3
$0.9$
Nine tenths of the way.