Back to the on-screen lesson ·
Migration is explained by push factors, pull factors, networks and policies, measured as a rate per thousand, and shaped by distance.
Paper packet. Every task here also exists on screen, where it is checked automatically; answers written on paper are not assessed by Nydus. When you are back at a device, enter your answers there.
By the end of this lesson you will be able to sort the influences on a migration into push, pull, network and policy, and measure a migration as a rate.
You can write a population change as natural increase plus net migration, and turn a count into a rate per thousand. This lesson opens up the migration entry: who moves, why they move, and why they go to one place rather than another.
| Term | What it means |
|---|---|
| Migration | A move that changes where a person lives, for a long period. |
| Push factor | A condition at the origin that drives people away. |
| Pull factor | A condition at a destination that draws people to it. |
| Intervening obstacle | A cost, distance, border or danger between the origin and the destination. |
| Chain migration | Moving to a place because family or friends have already moved there. |
| Net migration rate | Arrivals minus departures per thousand people in a year. |
| Distance decay | The tendency for fewer people to move, or interact, the farther apart two places are. |
A migration is explained by sorting its influences into four kinds:
How much a migration changes a place is measured by its rate:
$$\text{net migration rate} = \dfrac{\text{in} - \text{out}}{\text{population}} \times 1000.$$
Another way: picture
Picture a family deciding whether to move. On one side of a scale sit the reasons to leave home; on the other, the reasons to stay. A cousin in another city tips the scale and points to where; a visa, or the lack of one, decides whether the door is open at all.
Another way: steps
A flow count shows a move, not its motive. To test a jobs explanation, examine employment opportunities before and after the move, rents and housing access, family networks, and disruptions at the origin. A useful comparison includes places exposed to one proposed cause but not another. If jobs and a drought both change at once, their coincidence does not separate them.
Suppose invented towns Pine and Elm receive similar numbers of newcomers after a regional flood. Pine opens a factory; Elm does not. Both towns have relatives of displaced households. The shared timing is consistent with displacement and family support, while Pine's factory may explain only an additional difference. Interview evidence can help, but ask whom the sample misses: people unable to move, people outside formal employment and people who returned. Conclude with the causes supported, a rival still possible and one observation that could discriminate between them.
Geographers have tried to explain migration since Ernst Ravenstein studied the British census in the 1880s. He noticed that most migrants move short distances, that big cities draw people from far away, and that each flow of migrants tends to produce a smaller flow in the opposite direction.
In 1966 Everett Lee set out the idea that still organizes the subject: every move weighs the conditions at the origin against those at a destination, with obstacles in between, and each person weighs them differently.
A push factor acts at the place people leave. Drought, war, persecution, a factory closing or a lack of land all make staying harder. In the 1930s the Dust Bowl pushed tens of thousands of farm families out of Oklahoma, Texas and Kansas as dust storms stripped their fields.
A push factor alone does not say where people will go. It explains why they leave, and a separate reason must explain the destination they choose.
A pull factor acts at the destination. Jobs, higher wages, safety, good schools, a warm climate or cheaper housing all draw people toward a place. Many families who left the Dust Bowl headed for California because of reports of farm work in its valleys.
The same condition can push from one place and pull to another. Low wages at home push; high wages elsewhere pull. Naming where the condition acts keeps the two apart.
People rarely move to a place where they know no one. Family and friends who went before send news, lend money for the journey, share housing and help newcomers find work. This is why migrants from one village often settle in the same neighborhood of a distant city.
Networks make migration grow once it starts, a pattern called chain migration. They also explain why two places with similar jobs attract very different numbers of movers.
Governments shape migration through laws. A visa program can open the way for nurses or engineers; a quota can close it. The Immigration and Nationality Act of 1965 ended the national-origin quotas in United States law and changed which countries most immigrants came from.
Policy acts inside countries too. Housing rules, the location of military bases or universities, and programs that move refugees to particular cities all steer where people settle.
Between origin and destination lie obstacles: the cost of the journey, the distance, a border, a language to learn, or danger on the way. An obstacle does not push or pull; it makes the move harder.
Cheaper transport and cheaper phone calls have lowered many obstacles over the past century. That is one reason migration over long distances has grown, even where pushes and pulls have not changed much.
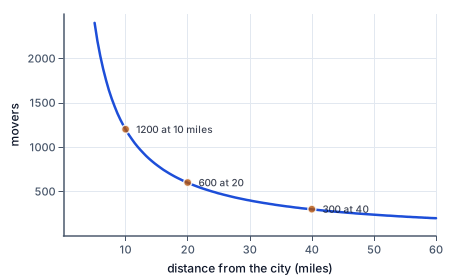
Ravenstein's first observation still holds: more people move short distances than long ones. Under a simple rule where movers fall off as one over distance, a town twice as far sends half as many movers.
A gravity rule adds size. A city's draw is its population divided by the square of its distance, so a large city far away can draw as many movers as a small city nearby. These rules describe averages; each move still has its own reasons.
Net migration, arrivals minus departures, says how much a place gained or lost. Divided by the population and multiplied by a thousand, it becomes a rate that can compare a small county with a large one.
Gross migration, arrivals plus departures, measures turnover. A county with $3000$ arrivals and $2900$ departures has a net migration of only $100$, but thousands of people have come and gone, which matters to its schools and landlords.
Checking an answer. Most counties' net migration rates lie between about minus twenty and plus thirty per thousand. A rate of several hundred usually means the flows were added instead of subtracted.
Sorting influences by where they act is allowed because a push and a pull are defined by their place, not by their content. The same wage gap is a push at one end and a pull at the other.
Dividing by the population is allowed because the rate describes the share of the place that moved, not the count. Two counties with the same rate lost or gained the same share of their people, whatever their size.
Between about 1910 and 1970, some six million African Americans moved from the rural South to cities of the North and West, such as Chicago, Detroit, New York and Los Angeles. It is one of the largest internal migrations in American history.
All four kinds of influence were at work: segregation, violence and poor wages pushed; factory jobs pulled, especially during the two world wars; family networks chose the cities; and the end of large-scale European immigration after 1924 opened industrial jobs to Southern workers.
Since the 1970s Americans have moved in large numbers from the Northeast and Midwest to the South and West. Jobs in new industries, lower housing costs and warmer winters pull; factory closings in older industrial cities push.
Air conditioning, spreading after World War II, lowered an obstacle by making summers in places such as Phoenix and Houston easier to bear. Retirees add their own flow toward Florida and Arizona, which is why those states can grow even when deaths outnumber births in some counties.
Some moves are chosen; others are forced by war, persecution or disaster. A refugee is a person who has crossed an international border to escape persecution or conflict. People forced from their homes who stay inside their own country are called internally displaced.
The line between forced and voluntary is not always sharp. A family leaving a farm after years of drought has chosen to go, but the drought left it little choice. Stating the evidence for each influence keeps the explanation honest.
Ravenstein noticed that each stream of migrants has a counter-stream flowing back. Some migrants return home after a few years, having saved money or learned a trade; others move on again.
This is one reason net migration understates how many people move. It also means that migration ties places together: money sent home, called remittances, and ideas carried back can change the origin as much as the migrants change the destination.
The most common slip is to treat a push as a pull, or the reverse. Ask where the condition is: at home, it pushes; at the destination, it pulls.
Another is to explain a migration with a single cause. Most moves combine a push and a pull, and a network or a policy often decides the destination. A third is to add arrivals and departures when a net figure is wanted, which gives turnover, not net migration.
Between about 1910 and 1970 some six million Black Southerners moved north and west, reshaping American cities. Chicago's Black population grew from about $44000$ in 1910 to more than $800000$ by 1960, and whole neighborhoods, churches and businesses were built by the newcomers.
The pushes were segregation under Jim Crow laws, the threat of violence, and farm work that paid little and was hurt further by the boll weevil's damage to cotton. The pulls were factory jobs in steel, meatpacking and automobiles, which opened wider during both world wars when factories needed workers. Newspapers such as the Chicago Defender printed train schedules and job notices, and letters from relatives who had already moved made the choice of city.
Policy played its part too. The immigration laws of 1924 sharply cut the number of European immigrants, so Northern employers recruited Southern workers instead. Historians still use the four kinds of influence to explain why the migration began when it did and why particular Southern states sent people to particular Northern cities.
Each year the U.S. Census Bureau estimates how many people move between states. Its estimates use federal tax returns, which show when a filer's address moves from one state to another, and Medicare records for older adults who do not file.
In recent years the estimates have shown a steady flow toward the South. Texas, Florida, North Carolina and South Carolina have gained hundreds of thousands of people a year from other states, while California, New York and Illinois have lost them. Counties around fast-growing cities such as Boise, Charlotte and Austin have recorded net domestic migration rates of twenty or more per thousand.
The rate measures the move; it does not explain it. Surveys of movers point to housing costs, jobs and family as the leading reasons, with climate and taxes mattering to some. A geographer explaining a county's gain names which of those influences the evidence supports, and gives the year and source of every figure.
It is natural to think people move only because something is wrong where they live. But most moves weigh what drives people from home against what draws them elsewhere, and many are mostly pulls: a better job, a university, family already settled in a new city.
A push alone cannot explain where people go. A network or a policy often decides the destination, which is why migrants from one town cluster in one neighborhood of a distant city. An explanation that names only a push leaves out most of the story.
A family leaves a village where the only factory has closed. Classify the closing.
$\text{push factor}$
It acts at the origin.
They choose a city where warehouses are hiring. Classify the hiring.
$\text{pull factor}$
It acts at the destination.
An uncle there offers them a room. Classify the uncle's help.
$\text{network}$
A person who went before.
State the explanation in one sentence.
$\text{push + pull, steered by a network}$
Several kinds together.
A county of $50000$ people gains $2400$ arrivals. Record the arrivals.
$\text{in} = 2400$
People moving in.
It loses $1900$ departures. Find the net migration.
$2400 - 1900 = 500$
In minus out.
Find the rate per thousand.
$\dfrac{500}{50000} \times 1000 = 10$
Ten per thousand.
Find the gross migration.
$2400 + 1900 = 4300$
Turnover.
Compare the net with the gross.
$500 \text{ of } 4300$
Most moves cancel out.
City A has $900$ thousand people $30$ miles from a town. Find its draw.
$\dfrac{900}{30^2} = 1$
Population over distance squared.
City B has $4000$ thousand people $50$ miles away. Find its draw.
$\dfrac{4000}{50^2} = 1.6$
The same rule.
Compare the draws.
$\dfrac{1.6}{1} = 1.6$
B draws more.
Say why the bigger city wins here.
$\text{size outweighs extra distance}$
Over four times the people, under twice the distance.
Name what the rule ignores.
$\text{jobs, family and cost}$
A real choice weighs more.
Give the conclusion with its limit.
$\text{B likely draws more, other things equal}$
A comparison, not a certainty.
Find the net migration.
$700 - 900 = -200$
More left than came.
Divide by the population.
$\dfrac{-200}{20000}$
Net movers per person.
Multiply by one thousand.
A study of a migration finds that fighting makes it unsafe to stay in the home region. What kind of influence on the migration is this?
Complete the worked solution: a town's movers choose between city A, with $4500$ thousand people $30$ miles away, and city B, with $9600$ thousand people $40$ miles away. Using a gravity rule, where a city's draw is its population divided by the square of its distance, find each city's draw and the ratio of B's draw to A's.
Find the draw of city A.
$\dfrac{4500}{30^2} =$ s
Population over distance squared.
Find the draw of city B.
$\dfrac{9600}{40^2} =$ t
The same rule.
Compare the two draws.
$\dfrac{\text{B}}{\text{A}} =$ q
Above one, B draws more movers.
Say what a real choice adds.
$\text{jobs, family and cost}$
The rule weighs only size and distance.
Match each term to its meaning.
| a condition that drives people from where they live | a condition that draws people to a destination | a cost, distance or border that stands in the way | moving to where family or friends have already gone | |
|---|---|---|---|---|
| push factor | ||||
| pull factor | ||||
| intervening obstacle | ||||
| chain migration |
A county of $40000$ people had $1800$ people move in and $1400$ move out in a year. Fill in its net migration, its net migration rate per thousand, and its gross migration. Write a loss as a negative number.
| value | |
|---|---|
| net migration (people) | |
| net migration rate (per thousand) | |
| gross migration (people) |
A survey finds that $500$ people moved to a city from a town $48$ miles away. Suppose the number of movers from a town falls off as one over its distance. Write the movers from a town of the same size as a function of its distance $d$ in miles.
Answer:
A region of $125000$ people gained $3900$ arrivals and lost $4650$ departures in a year. What is its net migration rate, per thousand people? Write a loss as a negative number.
Answer: per 1,000
Suppose a county in northern Illinois, with $150000$ people, gained $6200$ people moving in from other states and lost $7400$ people moving out to other states in a year. What is its net domestic migration rate per thousand? Write a loss as a negative number.
Answer: per 1,000
After a drought, 5 hundred people leave Valley. Two destinations offer equal wages and vacancies, but most newcomers choose the one with established family contacts. A report says higher wages alone explain the destination choice. Which evaluation fits the indicators?
Lesson test: one question per skill, one attempt each, no hints. Your answers are checked when you submit.
A survey finds that $1200$ people moved to a city from a town $10$ miles away. Suppose the number of movers from a town falls off as one over its distance. Write the movers from a town of the same size as a function of its distance $d$ in miles.
Answer:
You can explain a migration. Explain why knowing what drove people from home does not tell you where they went.
27. Your turn: a county of $20000$ people has $700$ arrivals and $900$ departures. What is its net migration rate per thousand?, step 3
$-10$
Per thousand.