Back to the on-screen lesson ·
One global change reaches each region through its setting: faster Arctic warming, wetter wet places and drier dry ones, low coasts flooding first, and extremes past thresholds.
Paper packet. Every task here also exists on screen, where it is checked automatically; answers written on paper are not assessed by Nydus. When you are back at a device, enter your answers there.
By the end of this lesson you will be able to explain and measure why a global change has regionally different effects.
You know what causes warming, how evidence shows it, and how exposure and vulnerability turn a hazard into a disaster. This lesson asks why a single global change has such different effects from one region to another.
| Term | What it means |
|---|---|
| Global average | One number for the whole planet, which describes no particular place. |
| Arctic amplification | The Arctic's warming several times faster than the global average. |
| Albedo | How much sunlight a surface reflects; ice reflects most, dark ocean little. |
| Extreme event | A heat wave, downpour, drought or flood near the far end of what a place usually sees. |
| Threshold | A level, such as 95 °F or a flood stage, above which harm begins. |
| High-tide flooding | Flooding of low coastal streets at high tide, without a storm. |
A region's change depends on its setting:
$$\text{regional warming} = \text{multiple} \times \text{global warming}.$$
So impacts are described region by region, never by the global average alone.
Another way: picture
Picture raising the water in a bathtub by half an inch. For most of the tub nothing seems to change, but a toy boat resting on the lowest part of the bottom suddenly floats. The same small change matters most where things sit closest to a threshold.
Another way: steps
The global average temperature is a useful summary, but no one lives in the global average. Oceans warm more slowly than land, the poles faster than the tropics, and nights in many places faster than days.
So a statement such as the world has warmed about two degrees Fahrenheit must be translated before it says anything about a particular place. That translation, region by region, is what impact studies do.
The Arctic has warmed about three to four times as fast as the global average since 1979, according to recent studies. The main reason is ice. Bright sea ice reflects most sunlight; as it melts, the dark ocean beneath absorbs it and warms further.
That feedback makes the Arctic the fastest-changing region on Earth. In Alaska, thawing permafrost is cracking roads and buildings, and coastal villages are losing the sea ice that once shielded them from winter storms.
Warmer air holds more water vapor, about seven percent more for each degree Celsius. Where storms bring moisture, it falls in heavier downpours. Where the air is dry, warmth draws more water out of soils, rivers and plants.
This is why wet regions tend to get wetter and dry regions drier. It is a tendency, not a rule for every place, but it explains much of the pattern of projected rainfall change.
The Fourth National Climate Assessment found that the amount of rain falling in the heaviest downpours rose across most of the country between 1958 and 2016. The biggest increase, about fifty-five percent, was in the Northeast; the Midwest saw about forty percent.
Storm drains, culverts and basements were built for the rains of the past. Heavier downpours overwhelm them, which is why flash flooding has become a larger problem even in cities far from rivers.
The American Southwest has warmed faster than the national average, and higher temperatures dry its soils and shrink its snowpack. The Colorado River, which supplies water to about forty million people, carries less water than the amount promised to the states that share it.
Warming turns dry years into deeper droughts. Even when rain and snow are close to normal, more of the water evaporates before reaching the river.
Many harms begin at a threshold: a temperature at which crops suffer, a river level at which it floods, a tide at which streets go under. When the average shifts even slightly, the number of days past the threshold can rise far faster.
A city that had ten days a year above $95$ °F might have twenty-five a few decades later, a rise of $150$ percent, though its average temperature rose only a degree or two. Impacts follow the extremes more than the averages.
The sea is rising everywhere, but the harm depends on the coast. Low, flat coasts such as the Gulf of Mexico, the Chesapeake Bay and South Florida flood first. Where the land is sinking, as in coastal Louisiana and around Norfolk, Virginia, the local rise is faster still.
Flooding at high tide, without any storm, has become common in cities such as Miami, Charleston and Annapolis. Each inch of sea level puts more tides over the threshold at which streets flood.
Crops grow best within a range of temperatures. Corn yields fall sharply on days hotter than about $84$ °F, according to studies of American farm data, and hot nights harm them too.
Warmer winters can help some crops in northern states, where the growing season is lengthening, while heat and drought hurt others farther south. The impact on agriculture is a regional balance of gains and losses, not one number.
Checking an answer. A region warming faster than average warms more than the global figure. A percent rise multiplies by more than one, a fall by less than one.
Scaling the global change is allowed because studies measure each region's change against the global one, and the multiple has stayed fairly steady over the decades measured.
Treating the seven percent per degree as compounding is allowed because each degree raises the capacity of air that is already warmer. The rule is an average from physics, and real downpours in a place can grow faster or slower.
Heat is the deadliest weather hazard in the United States in most years. It falls hardest on older people, outdoor workers and people without air conditioning, and on city neighborhoods with little shade.
So the same heat wave has very different impacts on different blocks of the same city. The impact depends on exposure and vulnerability, as with every hazard, not only on the temperature.
As regions warm, plants and animals shift toward the poles and uphill where they can. Some fish, such as lobster off New England, have moved north into cooler water, changing which towns can catch them.
Species that cannot move fast enough, or that already live on mountaintops, lose their habitat. Forests in the West face more fires and beetle outbreaks as heat and drought stress the trees.
The regions that emit least often face the largest impacts. Low-lying island nations, farmers in drought-prone regions and Arctic communities contributed little to the carbon dioxide in the air but feel the changes first and hardest.
Within the United States, too, impacts follow existing inequalities: neighborhoods with fewer trees, older housing or homes on flood-prone land suffer more. Climate impacts add to the spatial inequality studied earlier in this course.
Regional impacts are projected with climate models run under different emissions scenarios. The results give ranges, not single numbers, and regional projections are less certain than global ones.
A careful statement gives the scenario, the period and the range: under a given path of emissions, rainfall in a region is projected to change by an amount within a stated range by a stated date. The later the date, the more it depends on choices still to be made.
The most common slip is assuming every place warms by the global average. Another is adding a region's multiple to the global warming instead of multiplying.
A third is expecting warming to make every place drier, or every place wetter, when the pattern differs by region. A fourth is judging impacts from averages when harm follows the extremes past a threshold.
Newtok, a Yup'ik village on the western coast of Alaska, sat on permafrost beside the Ninglick River. As the Arctic warmed, the frozen ground thawed and the riverbank eroded quickly, eating away land that homes, the school and the water supply stood on.
Warming did more than melt the ground. Sea ice that once formed early in the fall and protected the shore from storms now forms later, so autumn storms batter the coast. After years of planning, residents began moving in 2019 to a new village, Mertarvik, on higher, rockier ground across the river.
Newtok shows Arctic amplification as a lived impact. The global average warming is a couple of degrees; in western Alaska the change has been several times larger, and it has combined with a village's exposure on thawing ground to force a move. Several other Alaskan villages face the same choice.
The Colorado River supplies water to about forty million people in seven states and Mexico, and irrigates farms from Colorado to California's Imperial Valley. Its water was divided among the states in 1922, in years that turned out to be unusually wet.
Since 2000 the river's basin has been in a long drought made worse by heat. Warmer temperatures shrink the mountain snowpack and evaporate more water before it reaches the river. Lake Mead, the reservoir behind Hoover Dam, fell to roughly a quarter full in 2022, and in 2021 the federal government declared the first official shortage on the river, cutting Arizona's share.
The same global warming that brings heavier downpours to the Northeast deepens drought in the Southwest. The states now negotiate how to share a smaller river, which shows that a regional impact becomes a question of who gets water, not only of how much falls.
It is natural to picture global warming as every place getting a little warmer by the same amount. But the Arctic warms several times faster than the average, oceans more slowly than land, and warming makes some regions wetter and others drier.
The harm follows the region's setting and its thresholds: a small rise in the sea floods low, sinking coasts first, and a small rise in the average multiplies the days past a dangerous temperature. Describe impacts region by region, with numbers for that region.
Suppose the world warms by $2.2$ °F. Record the global figure.
$2.2$
The average.
A northern region warms three times as fast. Write the multiple.
$\times 3$
Times as fast.
Find the region's warming.
$3 \times 2.2 = 6.6$
°F.
Say why it warms faster.
$\text{melting ice, darker surface}$
More sunlight absorbed.
A wet region gets $40$ inches a year, projected to rise $10$ percent. Find its new rainfall.
$40 \times 1.1 = 44$
Up by a tenth.
A dry region gets $12$ inches, projected to fall $25$ percent. Find its new rainfall.
$12 \times 0.75 = 9$
Down by a quarter.
Find the old gap.
$40 - 12 = 28$
Inches.
Find the new gap.
$44 - 9 = 35$
Inches.
Describe the pattern.
$\text{wet gets wetter, dry gets drier}$
The contrast grows.
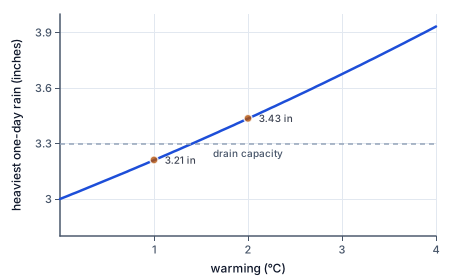
A town's heaviest one-day rain is $3$ inches. Find it after one degree Celsius of warming.
$3 \times 1.07 = 3.21$
Seven percent more.
Find it after two degrees.
$3 \times 1.07^2 \approx 3.43$
The growth compounds.
Its storm drains handle $3.3$ inches a day. Compare with the first result.
$3.21 < 3.3$
Still within capacity.
Compare with the second result.
$3.43 > 3.3$
Past the threshold.
Say what the town faces.
$\text{flash flooding in the heaviest storms}$
A small change crosses a threshold.
Name a response.
$\text{larger drains or green space}$
Adaptation.
Write the multiple.
$\times 4$
Times as fast.
Multiply the global warming by it.
$4 \times 1.5$
The regional warming.
Evaluate the regional warming.
Suppose the world as a whole warms by $2.4$ °F, and a northern region warms $1.5$ times as fast as the global average. By how much does that region warm?
Complete the worked solution: a farm's wheat yields $50$ bushels an acre. Suppose each degree Fahrenheit of summer warming cuts the yield by $4$ percent, and summers warm by $1.5$ °F. Find the percent lost, the bushels an acre lost, and the new yield.
Find the percent lost.
$\text{loss per degree} \times \text{degrees} =$ l
Percent of the yield.
Find the bushels lost.
$\text{yield} \times \dfrac{\text{percent lost}}{100} =$ b
Bushels an acre.
Find the new yield.
$\text{yield} - \text{bushels lost} =$ n
What remains.
Name what could offset the loss.
$\text{heat-tolerant seeds, new planting dates}$
Adaptation, the next lesson's subject.
Match each regional impact to the reason it happens there.
| melting ice uncovers darker ocean that absorbs more sunlight | warmer air holds more water vapor to fall as rain | higher temperatures evaporate more water from soils and plants | the land is low and in places sinking as the sea rises | |
|---|---|---|---|---|
| the Arctic warms fastest | ||||
| downpours grow heavier | ||||
| dry regions dry further | ||||
| some coasts flood first |
A wet region gets $30$ inches of rain a year, and a projection has it rising by $10$ percent. A dry region gets $15$ inches, projected to fall by $10$ percent. Fill in each region's new rainfall and the new gap between them, in inches.
| value | |
|---|---|
| wet region's new rainfall (inches) | |
| dry region's new rainfall (inches) | |
| new gap between them (inches) |
A town's heaviest one-day rainfall of the year is $1.5$ inches. Suppose it grows by about seven percent for each degree Celsius of warming, as the air's capacity for water does. Write the heaviest rainfall as a function of the warming $t$ in degrees Celsius.
Answer:
A city averaged $10$ days a year above 95 °F in the 1980s and $25$ days a year in the 2010s. By what percent did the number of such days rise?
Answer: %
Suppose a bayside town in Florida had $2$ days a year of flooding at high tide in the 2000s and $11$ days a year in the 2020s. How many times as many flood days does it now have?
Answer: times
Lesson test: one question per skill, one attempt each, no hints. Your answers are checked when you submit.
A town's heaviest one-day rainfall of the year is $4$ inches. Suppose it grows by about seven percent for each degree Celsius of warming, as the air's capacity for water does. Write the heaviest rainfall as a function of the warming $t$ in degrees Celsius.
Answer:
You can explain regional impacts. Explain why the Arctic warms several times faster than the global average.
26. Your turn: suppose the world warms by $1.5$ °F and a region warms four times as fast. How much does the region warm?, step 3
$6\ \text{°F}$
Four times the average.