Back to the on-screen lesson ·
A climate graph averages thirty years of weather month by month; its range, mean and rainfall pattern name a climate, and Fahrenheit is 1.8 times Celsius plus 32.
Paper packet. Every task here also exists on screen, where it is checked automatically; answers written on paper are not assessed by Nydus. When you are back at a device, enter your answers there.
By the end of this lesson you will be able to read a climate graph, find its range and mean, convert to Fahrenheit, and name the climate it shows.
You met biomes and climates in Grade 5, and you can read line graphs and bar graphs. A climate graph combines both to show a place's typical year, and this lesson reads the numbers a geographer takes from it.
| Term | What it means |
|---|---|
| Climate | The average weather of a place over a long period, usually thirty years. |
| Weather | The state of the air at one time and place. |
| Climate graph | A graph of a place's monthly mean temperature as a line and precipitation as bars. |
| Annual range | The warmest month's mean temperature minus the coldest month's. |
| Mean annual temperature | The average of the twelve monthly means. |
| Continentality | The larger temperature range of places far from the sea. |
A climate graph shows the average of about thirty years of weather, month by month.
Converting to Fahrenheit for American readers uses $F = 1.8C + 32$.
Another way: picture
Picture thirty calendars stacked on top of each other, one for each year, and averaging every January together, every February together, and so on. The climate graph is that averaged calendar: not any real year, but the year you would expect.
Another way: steps
A change in temperature is not the final temperature. If a station starts at 4 degrees Celsius and warms by c degrees, its final reading is 4+c Celsius. Convert the whole reading: F=1.8(4+c)+32=1.8c+39.2. At zero change it remains 39.2 Fahrenheit; each extra Celsius degree adds 1.8 Fahrenheit degrees. The 32-degree offset converts temperature scales, so do not add it when converting a temperature difference alone.
Two places can receive the same annual rainfall but have different water stresses. In an invented comparison, Lowland receives most rain in its cool season while Plateau receives it during its warm growing season. Equal annual sums do not establish equal soil moisture because evaporative demand and the timing of plant growth differ. Inspect monthly pairs of precipitation and temperature before drawing an ecological conclusion.
Land-cover records add a second limit. A satellite map of one valley in one year and a climate average for a large region over thirty years have different extents and periods. Their association can generate a hypothesis, but it cannot establish that climate caused a recent clearing. Compare cover maps using the same classification and season, look for land-use records, and ask how representative the station is of elevation and exposure across the mapped area. Unknown years or changed map classes should lower confidence rather than being silently combined.
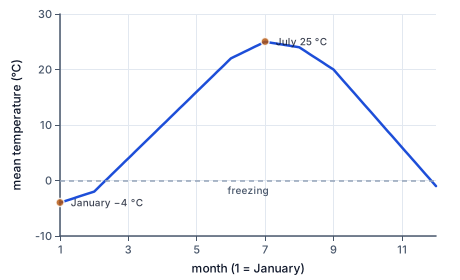
This invented Midwestern city is coldest in January at $-4$ °C and warmest in July at $25$ °C, a range of $29$ degrees. Three months average below freezing: January, February and December. Its large range marks a continental climate, far from the moderating sea.
Different climates leave different fingerprints on a climate graph.
| Climate | Temperature | Precipitation | American example |
|---|---|---|---|
| tropical rainforest | hot all year, tiny range | heavy every month | none on the mainland |
| hot desert | hot, large daily range | very little | Phoenix, Arizona |
| continental | cold winters, warm summers | mostly summer | Minneapolis, Minnesota |
| Mediterranean | mild winters, warm summers | winter only | Los Angeles, California |
| humid subtropical | hot summers, mild winters | all year | Atlanta, Georgia |
Water warms and cools far more slowly than land. So places beside the sea have mild winters and cool summers, a small range, while places deep inside a continent have cold winters and hot summers, a large range. This is continentality.
San Francisco's monthly means vary by only a few degrees through the year; Fargo, North Dakota, far inland, swings by dozens of degrees between January and July.
Near the equator the sun is high all year, so temperatures barely change with the seasons. Farther toward the poles, the sun is high in summer and low in winter, and days are long in summer and short in winter, so the range grows.
That is why Miami's range is small and Anchorage's large, even though both are near the sea.
When the coldest month is below freezing, subtracting it adds its size. A July of $25$ and a January of $-4$ give $25 - (-4) = 29$, not $21$.
A number line helps: from $-4$ up to $0$ is four degrees, and from $0$ up to $25$ is twenty-five more, twenty-nine in all.
Scientists and most of the world use Celsius; American weather reports use Fahrenheit. To convert a temperature, multiply by $1.8$ and add $32$: $25$ °C is $1.8 \times 25 + 32 = 77$ °F.
A range is a difference, so it converts without the $32$: a $29$-degree Celsius range is $1.8 \times 29$, about $52$ degrees Fahrenheit.
Adding the twelve monthly means and dividing by twelve gives the mean annual temperature. But the mean alone can mislead: a desert city and a coastal city can have the same mean and very different years.
Geographers always report the mean with the range, and the total precipitation with when it falls.
The National Oceanic and Atmospheric Administration, NOAA, publishes climate normals for thousands of American weather stations: thirty-year averages of temperature and precipitation for every month. The current normals average the years 1991 to 2020.
Every ten years the normals are updated. Across much of the country the newest normals are warmer than the old ones, one of the clearest signs of a changing climate.
Checking an answer. The range is never negative, and it is always at least as large as the warmest month when the coldest is below zero.
Subtracting the coldest from the warmest is allowed because the range measures the distance between them on the temperature scale. Averaging monthly means is allowed because each month counts once, giving a fair yearly mean, though months differ slightly in length.
Converting with $1.8$ and $32$ is allowed because the two scales are linked by a straight line: freezing at $0$ and $32$, boiling at $100$ and $212$.
A climate graph predicts how people live. A large range means heating in winter and cooling in summer. The months below freezing mean snow tires, frozen pipes and a short growing season. The rainfall pattern decides whether farmers need irrigation.
Builders use climate normals to size heating and air-conditioning systems, and farmers use them to choose crops and planting dates.
The most common slip is dropping the sign of a below-freezing month, giving too small a range. Another is reading a climate graph as one year's weather.
A third is adding $32$ when converting a range, which is a difference, not a temperature. A fourth is judging a climate by its mean alone.
Fargo, North Dakota, and San Francisco, California, lie at roughly similar latitudes in the northern half of the country, yet their climates could hardly be more different. Fargo's January mean is below 10 °F, and its July mean is near 70 °F: a range of more than sixty degrees Fahrenheit. San Francisco's monthly means stay within about ten or fifteen degrees of each other all year.
The difference is the sea. San Francisco sits beside the Pacific Ocean, whose cool, slowly changing water keeps winters mild and summers cool; the city's famous summer fog comes from that cold water. Fargo lies in the middle of the continent, where the land heats quickly in summer and loses heat quickly in winter.
The two climate graphs show continentality at a glance: a flat line by the sea, a deep curve inland. They also explain the cities' daily lives, from Fargo's engine block heaters to San Francisco's rarely used air conditioners.
Every ten years, NOAA's National Centers for Environmental Information publishes new climate normals: thirty-year averages of monthly temperature and precipitation for thousands of weather stations across the United States. The latest normals cover 1991 to 2020.
Farmers use them to choose planting dates, engineers to design storm drains and heating systems, and power companies to plan for summer demand. A climate graph for any American town can be drawn from them in minutes.
Comparing one set of normals with the last shows how climate is changing. The 1991 to 2020 normals were warmer than the 1981 to 2010 normals across most of the country, especially in the South and West, and wetter in much of the East. The graphs a geographer draws today are already slightly different from those drawn a decade ago.
It is easy to read a climate graph as a record of one year, but it averages about thirty years; any single year may be warmer, colder, wetter or drier. It is also easy to read the range carelessly when winter falls below zero, subtracting the size of the number and losing its sign.
Treat the graph as the expected year, and when the coldest month is below zero, remember that subtracting a negative number adds its size: $25 - (-4)$ is $29$.
January's mean is $-10$ °C and July's is $20$ °C. Write the range.
$20 - (-10)$
Warmest minus coldest.
Evaluate the expression.
$30\ °\text{C}$
Subtracting a negative adds.
Check on a number line.
$10 + 20 = 30$
Ten up to zero, twenty more.
Name the climate.
$\text{continental}$
A large range.
Twelve monthly means add up to $150$ °C. Divide by twelve.
$\dfrac{150}{12} = 12.5\ °\text{C}$
The mean.
Convert it to Fahrenheit.
$1.8 \times 12.5 + 32 = 54.5\ °\text{F}$
Multiply, then add.
Its range is $25$ °C. Convert the range.
$1.8 \times 25 = 45\ °\text{F}$
No 32 for a difference.
Say why both numbers are needed.
$\text{mean and range describe the year}$
Together.
Say what else a geographer adds.
$\text{precipitation and its timing}$
The bars.
A coastal city: January $10$ °C, July $17$ °C. Find its range.
$17 - 10 = 7\ °\text{C}$
Small.
An inland city: January $-12$ °C, July $23$ °C. Find its range.
$23 - (-12) = 35\ °\text{C}$
Large.
Find the difference in range.
$35 - 7 = 28\ °\text{C}$
Inland swings much more.
Explain the difference.
$\text{continentality}$
The sea moderates the coast.
Convert the inland range to Fahrenheit.
$1.8 \times 35 = 63\ °\text{F}$
A difference, no 32.
Say which city needs more heating.
$\text{the inland city}$
Its winter is far colder.
Write the range.
$15 - (-15)$
Warmest minus coldest.
Evaluate the expression.
$30\ °\text{C}$
Subtracting a negative adds.
Name the climate.
A place's coldest month has a mean temperature of $2$ °C and its warmest month a mean of $22$ °C. What is its annual temperature range?
Complete the worked solution: a city's January mean is $-4$ °C and its July mean $25$ °C. Find its annual range, and July's mean in degrees Fahrenheit for an American weather report.
Find the range.
$\text{July} - \text{January} =$ r
Degrees Celsius.
Convert July to Fahrenheit.
$1.8 \times \text{July} + 32 =$ f
Degrees Fahrenheit.
Say why ranges differ between places.
$\text{distance from the sea}$
Water warms and cools slowly.
Say what a range in Fahrenheit would be.
$1.8 \times \text{the Celsius range}$
No 32, since it is a difference.
Match each climate graph's pattern to the climate it shows.
| tropical rainforest | hot desert | continental | Mediterranean | |
|---|---|---|---|---|
| about 27 °C every month, more than 150 mm of rain every month | ||||
| hot summers, mild winters, less than 20 mm of rain in most months | ||||
| January below −10 °C, July above 20 °C, rain mainly in summer | ||||
| mild rainy winters, warm summers with almost no rain |
A climate graph's temperature line for a Midwestern city reads $-4$ °C in January, $-2$ in February, $4$ in March, rising to $25$ in July, and falling to $-1$ in December; every month from March to November is above freezing. Fill in the coldest month's mean, the warmest month's mean, the range, and the number of months below freezing.
| value | |
|---|---|
| coldest month's mean (°C) | |
| warmest month's mean (°C) | |
| annual range (°C) | |
| months below freezing |
A station starts at $4$ °C and then warms by $c$ Celsius degrees. Use the conversion $F=1.8C+32$ to write its final Fahrenheit temperature as a function of the change $c$.
Answer:
A climate graph's twelve monthly mean temperatures add up to $96$ °C. What is the mean annual temperature?
Answer: °C
Suppose a city in coastal California has a January mean of $50$ °F and a July mean of $62$ °F. What is its annual temperature range, in degrees Fahrenheit?
Answer: °F
Two fictional basins each average 600 millimeters of rain annually. A receives most in cool months; B in warm months. A one-year land-cover map of 3 square kilometers in A shows less forest than an older regional map made with different classes. Which conclusion is defensible?
Lesson test: one question per skill, one attempt each, no hints. Your answers are checked when you submit.
A station starts at $4$ °C and then warms by $c$ Celsius degrees. Use the conversion $F=1.8C+32$ to write its final Fahrenheit temperature as a function of the change $c$.
Answer:
You can read a climate graph. Explain why a coastal city has a smaller temperature range than an inland one.
25. Your turn: a city's January mean is $-15$ °C and its July mean is $15$ °C. What is its range?, step 3
$\text{continental}$
A large range.