Back to the on-screen lesson ·
Contours join points of equal height at a fixed interval; their spacing shows steepness and their shapes show hills, valleys and ridges.
Paper packet. Every task here also exists on screen, where it is checked automatically; answers written on paper are not assessed by Nydus. When you are back at a device, enter your answers there.
By the end of this lesson you will be able to read heights from contour lines, find a contour interval, and recognize landforms from contour patterns.
You can find a point on a map with a six-figure grid reference, but the grid tells you nothing about how high the point is. This lesson adds height to the flat map, using lines that join places at the same elevation.
| Term | What it means |
|---|---|
| Contour line | A line on a map joining points at the same height above sea level. |
| Contour interval | The difference in height between neighboring contour lines. |
| Index contour | A bolder, labeled contour, usually every fifth line. |
| Spot height | A single point marked with its exact height, often a summit. |
| Relief | The difference in height between the highest and lowest points of an area. |
| Elevation | Height above mean sea level. |
A contour line joins every point at one height. Walk along a contour and you neither climb nor descend.
The height of the $n$-th contour above a base is the base height plus $n$ intervals.
Another way: picture
Picture slicing a hill with a stack of flat sheets of glass, one every twenty meters up, and tracing where each sheet touches the hill. Look down from above and you see a set of rings. Where the hill is steep, the rings crowd together; where it is gentle, they spread out.
Another way: steps
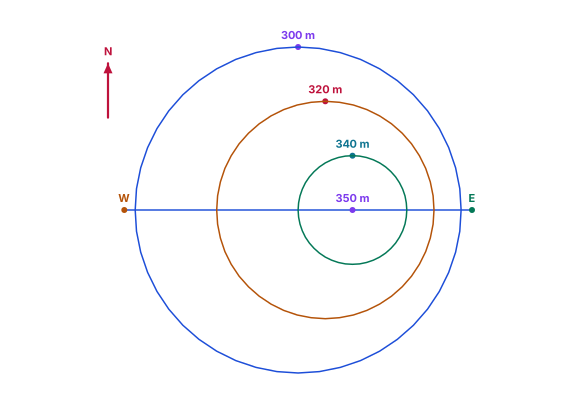
North is up on this invented plan. Each closed line joins equal elevations; the interval is 20 meters. The eastern contours are closer together, so that side is steeper, not necessarily higher. The 350-meter summit is a supplied spot height; the innermost contour alone would only bound its height.
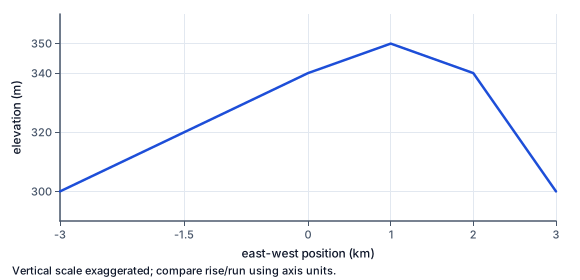
Follow the west-east section. Western contour crossings are 1.5 kilometers apart per 20-meter rise; eastern crossings are 0.5 kilometers apart per 20-meter fall. The eastern slope is three times as steep between crossings. Use the labeled units, not the apparent angle: the vertical scale is exaggerated. Straight segments interpolate between measured crossings and the summit; they do not claim additional survey measurements.
On a hillside whose lowest contour is $300$ m, with an interval of $20$ m:
| Contour above the base | Height (m) |
|---|---|
| 0 | 300 |
| 1 | 320 |
| 2 | 340 |
| 3 | 360 |
| 5 | 400 |
Each line is one interval higher than the line below, so the heights make a simple pattern: base plus interval times the count.
Surveyors once measured heights point by point with instruments on tripods. Today most contours are drawn from laser measurements taken from aircraft, a method called lidar, which records the height of the ground many times in every square meter.
A computer joins points of equal height into lines. The U.S. Geological Survey's 3D Elevation Program has been mapping the whole country this way.
To save you counting from the coast, every fifth contour is drawn bolder and labeled with its height: an index contour. The lines between are unlabeled, and you count up or down from the nearest index line.
Summits, road junctions and other key points often carry a spot height, a dot with an exact number, because the top of a hill is usually between two contours.
The interval is printed in the map's margin, but you can also work it out. Two index contours read $200$ and $300$ m with four lines between them: those four lines make five gaps, so each gap is $100 \div 5 = 20$ m.
Count gaps, not lines. Dividing by the number of lines instead gives an interval that is too large, and every height you read afterward is wrong.
Where contours crowd together, the land rises many meters over a short distance: a steep slope or a cliff. Where they spread apart, the land rises slowly: a gentle slope or a plain.
A common slip is to read crowded lines as high ground. Crowded lines are steep ground; a high plateau can have hardly any lines at all across its flat top.
Closed rings, each higher than the ring around it, are a hill, with the summit inside the smallest ring. Rings that get lower inward, often marked with small ticks, are a hollow.
Where a stream cuts a valley, the contours bend into V-shapes that point uphill, upstream. Where a ridge or spur sticks out, the V-shapes point downhill. A saddle, the low point between two summits, shows as two sets of rings facing each other.
Most points lie between contours. A point halfway between the $200$ m and $220$ m lines is about $210$ m high; a point a quarter of the way up is about $205$ m.
This is an estimate, because the ground between two contours may not slope evenly. For exact heights, surveyors use spot heights or elevation data.
Relief is the difference in height across an area: the highest point minus the lowest. A summit at $845$ m above a valley at $305$ m has $540$ m of relief.
Dividing relief by the interval counts the contour steps between them, $27$ steps at $20$ m. Relief says how much climbing there is; it does not say how steep, because it ignores how far apart the points are.
Most U.S. Geological Survey topographic maps give contours in feet, often with an interval of $20$ or $40$ feet in hilly country and $10$ feet or less on flat land. The method is the same in any unit: base plus interval times the count.
Always read the unit in the margin. A number read in meters on a map drawn in feet is off by a factor of more than three.
Checking an answer. A height between two contours must lie between their two heights. A height on a stream must fall as you go downstream.
Adding one interval per line is allowed because the interval is fixed across the whole map; that is what makes contour maps readable. Estimating between lines is allowed when the slope is roughly even, which is usually close enough for planning.
Reading spacing as steepness is allowed because every gap between neighboring lines is the same height difference, so a shorter gap on the map means the same rise over less ground.
A trail that crosses many contours in a short distance is a hard climb. Hikers count contours to estimate the height they will gain, and add time to their plans for it.
Engineers read contours to route roads and railroads along gentle slopes, to find where a dam can hold back water, and to see which land a flood will cover first.
The most common slip is dividing by the number of lines instead of the number of gaps when finding an interval. Another is reading a point between contours as the height of the nearer labeled line.
A third is reading closely spaced lines as high ground rather than steep ground. A fourth is reading V-shapes backward: in a valley they point uphill, toward the stream's source.
Longs Peak in Rocky Mountain National Park, Colorado, rises to 14,259 feet, the only peak over 14,000 feet in the park. The most popular route, the Keyhole Route, starts at a trailhead at about 9,400 feet, so climbers gain nearly 4,900 feet in about 7.5 miles one way.
On the park's USGS map, with a 40-foot contour interval, that gain crosses more than 120 contour lines. Near the top the lines crowd so closely that they nearly merge: the last stretch climbs steep rock ledges where one slip can be deadly.
Rangers urge climbers to start before dawn so they reach the summit and turn back before summer afternoon thunderstorms, which are common in the Rockies. Reading the contours before a trip tells climbers where the hard, slow ground will be, and how long the climb will really take.
The U.S. Geological Survey's 3D Elevation Program collects lidar data from aircraft that fire laser pulses at the ground and time their return. The result is a height for the ground many times in every square meter, even under trees.
From that data, computers draw contour lines far more exact than older maps drawn by hand from surveys and air photos. Engineers use it to plan roads and pipelines, emergency managers to predict which streets a flood will reach, and geologists to find old landslides and faults hidden by forest.
The contours on the new maps follow the same rules as those drawn a century ago: each line joins points of equal height, at a fixed interval. Better data changes how precisely the lines are drawn, not how they are read.
It is tempting to read a cluster of contour lines as the highest part of a map, and to read a point as the height of the nearest labeled line. Both slips lose what contours are for.
Crowded lines mean the height changes quickly: steep ground, wherever it is. The height of a point comes from counting intervals from a labeled line and estimating between lines, not from the nearest number printed on the map.
A spring lies halfway between the $340$ m and $360$ m contours. Find the interval.
$360 - 340 = 20\ \text{m}$
Neighboring lines.
Take half the interval.
$\dfrac{20}{2} = 10\ \text{m}$
Halfway up.
Add it to the lower contour.
$340 + 10 = 350\ \text{m}$
The spring's height.
Check it lies between.
$340 < 350 < 360$
Between the two lines.
Index contours read $500$ m and $750$ m with four lines between. Find the difference.
$750 - 500 = 250\ \text{m}$
Across the gaps.
Count the gaps.
$4 + 1 = 5$
Lines between plus one.
Divide the two numbers.
$\dfrac{250}{5} = 50\ \text{m}$
The interval.
Check with the lines.
$550, 600, 650, 700$
Four lines between.
Name the wrong answer to avoid.
$\dfrac{250}{4} = 62.5$
Dividing by lines, not gaps.
A summit is at $1230$ m and the valley floor at $630$ m. Find the relief.
$1230 - 630 = 600\ \text{m}$
Highest minus lowest.
The interval is $50$ m. Count the steps.
$\dfrac{600}{50} = 12$
Contour steps crossed.
Write the height of the $n$-th contour above the valley.
$630 + 50n$
Base plus interval times count.
Check at the top.
$630 + 50 \times 12 = 1230$
The summit.
Say what the relief omits.
$\text{the horizontal distance}$
So it says nothing about steepness.
Name the measure that adds it.
$\text{gradient}$
The next lesson.
Find the difference.
$500 - 400 = 100\ \text{m}$
Between the index contours.
Count the gaps.
$3 + 1 = 4$
Lines plus one.
Divide to find the interval.
On a map with a contour interval of $40$ m, a spring lies halfway between the $760$ m contour and the next contour above it. About how high is the spring?
Complete the worked solution: on a map with a contour interval of $20$ m, a summit is marked at $845$ m and the valley floor below it at $305$ m. Find the relief between them and the number of contour intervals a climber crosses.
Find the relief.
$\text{summit} - \text{valley} =$ r
Meters of height gained.
Count the intervals crossed.
$\dfrac{\text{relief}}{\text{interval}} =$ c
One interval per contour step.
Say what the count shows.
$\text{how much climbing, not how steep}$
Steepness needs the horizontal distance too.
Name the next measure.
$\text{gradient}$
Height over horizontal distance.
Match each contour pattern to the landform it shows.
| a steep slope | a gentle slope | a hill or summit | a valley with a stream | |
|---|---|---|---|---|
| contour lines packed closely together | ||||
| contour lines spread far apart | ||||
| closed rings, each higher than the one around it | ||||
| lines bending into V-shapes that point uphill |
A hillside's lowest contour is at $100$ m and the contour interval is $50$ m. Fill in the heights of the first, third and fifth contours above it.
| height | |
|---|---|
| first contour above (m) | |
| third contour above (m) | |
| fifth contour above (m) |
A map's lowest contour is at $150$ m and its contour interval is $10$ m. Write the height of the contour $n$ lines above it as a function of $n$.
Answer:
Two labeled index contours read $400$ m and $500$ m. Between them lie $3$ unlabeled contours, evenly stepped. What is the contour interval, in meters?
Answer: m
Suppose a trail in Zion National Park, Utah starts at $4400$ feet and ends at $5600$ feet. The U.S. Geological Survey map of the area has a contour interval of $40$ feet. How many contour intervals does the trail climb through?
Answer: intervals
Lesson test: one question per skill, one attempt each, no hints. Your answers are checked when you submit.
A map's lowest contour is at $100$ m and its contour interval is $50$ m. Write the height of the contour $n$ lines above it as a function of $n$.
Answer:
You can read contour lines. Explain why closely spaced contours mean steep ground rather than high ground.
25. Your turn: two index contours read $400$ m and $500$ m with three lines between them. What is the interval?, step 3
$\dfrac{100}{4} = 25\ \text{m}$
Each gap.