Back to the on-screen lesson ·
A cross-section plots the ground's height along a line from contour crossings, with a stated vertical exaggeration that makes slopes look steeper than they are.
Paper packet. Every task here also exists on screen, where it is checked automatically; answers written on paper are not assessed by Nydus. When you are back at a device, enter your answers there.
By the end of this lesson you will be able to draw and read a cross-section, state its vertical exaggeration, and work true gradients from it.
You can read heights from contours and work out a gradient from a map. A cross-section turns a line of those heights into a picture of the ground's shape, as if you sliced through the land and looked at it from the side.
| Term | What it means |
|---|---|
| Cross-section | A side view of the ground's shape along a line drawn on a map. |
| Section line | The straight line on the map along which the cross-section is drawn. |
| Profile | The line on a cross-section showing the height of the ground. |
| Vertical exaggeration | How many times more the vertical scale stretches heights than the horizontal scale stretches distances. |
| Plateau | A large area of high, fairly level ground, often with steep edges. |
A cross-section shows the height of the ground along a line.
An exaggerated section makes every slope look steeper than it is; the numbers, not the picture, give the true gradient.
Another way: picture
Picture cutting through a loaf of bread and looking at the cut face. The top edge of the slice shows the shape of the crust along the cut. A cross-section does the same for a hill: the top edge is the profile of the land along the section line.
Another way: steps
A cross-section is one slice through terrain, not a complete history. Combine it with map position and a sediment description. In a fictional valley, a broad trough and unsorted debris suggest a former glacier, while a narrow channel cut through those deposits and sorted gravel bars indicate later running water. The same place records both processes.
Write observations before inferences. A U-shaped profile is an observation about form; glacial erosion is a hypothesis. Poorly sorted material strengthens it, but a single deposit could also result from mass movement. Look for striated bedrock, several consistent valley sections or a mapped moraine before ruling out alternatives. Younger channels can rework older sediment, so do not assign one process to every layer. Keep the horizontal and vertical scales explicit when comparing valley shapes.
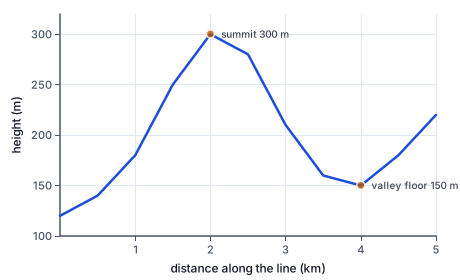
This section runs five kilometers across an invented map. The ground rises from $120$ m to a summit of $300$ m at $2$ km, falls to a valley floor of $150$ m at $4$ km, and climbs again. Its height scale is stretched about ten times, so the hill looks far steeper than it would to someone walking it.
Where the section line crosses a contour, you know the ground's height exactly: it is the contour's height. Mark each crossing on the paper strip with its height.
| Crossing on the map | Ground distance | Height |
|---|---|---|
| 2 cm | 1 km | 180 m |
| 4 cm | 2 km | 300 m |
| 8 cm | 4 km | 150 m |
This map has $1$ cm for $0.5$ km, so each map distance is halved to give kilometers.
Join the plotted points with a smooth curve rather than straight lines, because real ground rarely has sharp corners. At a summit or a valley floor between two contours of the same height, the curve rises or dips a little beyond the last contour, since the top of a hill is higher than its highest contour.
Rivers, roads and settlements crossed by the line can be labeled on the profile, which is how geographers show where things sit in the landscape.
Height differences are usually small compared with horizontal distances. A hill $200$ m high and $5$ km wide, drawn at the same scale both ways, would be a barely visible bump. So geographers stretch the vertical scale to make the shape readable.
If the horizontal scale is $1$ cm for $250$ m and the vertical $1$ cm for $25$ m, heights are stretched ten times: a vertical exaggeration of ten.
Stretching heights ten times makes every slope look ten times steeper. A real slope of one in twenty looks like one in two on the section.
That is not a lie as long as the exaggeration is printed. It becomes misleading when the exaggeration is left off, and a reader takes the picture's slopes as real. Always state the exaggeration, and work gradients from the numbers.
Cross-sections make landforms easy to see. A hill rises and falls; a river valley dips in a V; a wide, flat, low stretch beside a river is a floodplain; a flat top with steep sides is a plateau or, if small, a mesa.
Geologists draw sections of the rock underneath too, showing layers, faults and folds. The Grand Canyon is famous for exposing such layers in its walls, like a natural cross-section.
A section gives the heights and distances of any two points along the line, so it gives their average gradient: rise over run, with the run in the same unit as the rise. From a summit at $300$ m and $2$ km to a valley at $150$ m and $4$ km, the rise is $150$ m over a run of $2000$ m, about one in thirteen.
The profile's shape shows where the slope is steeper or gentler than that average.
One classic use of a cross-section is intervisibility: can a person at one point see another? Draw a straight line on the section from one to the other. If the ground rises above that line anywhere between them, the view is blocked.
Planners use this to site radio towers, fire lookouts and wind turbines, and to check which homes will see a new building.
Checking an answer. Every plotted point on a contour must sit exactly at that contour's height, and the profile must never cross a height it did not pass between two contours.
Plotting heights at contour crossings is allowed because the ground's height there is known exactly. Joining the points smoothly is an estimate, allowed because contours show that the ground changes steadily between them unless the map marks a cliff.
Stretching the vertical scale is allowed as long as it is stated, because it changes only how the section looks, not the heights and distances it records.
Road and railroad engineers draw long cross-sections, called profiles, along planned routes to find where they must cut through hills or build embankments across valleys. Hydrologists draw sections across rivers to measure how much water a channel can hold, which the next unit uses.
Hikers use elevation profiles of trails, printed on many maps and apps, to see where the long climbs are before they start.
The most common slip is judging a slope's true steepness from an exaggerated section. Another is dividing the scales the wrong way, giving an exaggeration less than one.
A third is forgetting to convert map distances to ground distances before plotting. A fourth is joining points with straight lines that put the summit exactly on the highest contour.
Many hiking and cycling apps show an elevation profile under the route: a small cross-section along the path. Its vertical axis is almost always stretched, which is why a gentle road can look like a mountain on the screen.
Reading the numbers on its axes, rather than the shape, tells you how hard the climb really is.
The Grand Canyon in Arizona is about a mile deep. The South Rim stands near 7,000 feet, the North Rim about 1,000 feet higher, and the Colorado River at the bottom, near Phantom Ranch, about 2,400 feet above sea level. The canyon is a cross-section drawn by nature: its walls expose layers of rock nearly two billion years old at the bottom and far younger at the top.
A true-scale cross-section from rim to river would show the canyon as a deep, steep notch. But the average grade from rim to river, over several miles, is only about fifteen to twenty percent, because the canyon drops in steps: sheer cliffs separated by gentler slopes and flat benches.
The Bright Angel Trail uses those benches, zigzagging down the cliffs in switchbacks that lengthen the route and lower its grade. Rangers warn that the hike out is far harder than the hike in, and that hikers should plan twice as long to climb out as to walk down.
When the transcontinental railroad was built in the 1860s, engineers surveyed routes across the Sierra Nevada and the Rocky Mountains by measuring heights along possible lines and drawing long profiles of each. Locomotives of the time could pull a train up only gentle grades, about two percent at most.
The profiles showed where a direct line would be far too steep. The engineers chose routes that followed river valleys and climbed slowly along mountainsides, and where they could not, they built tunnels and deep cuts through the hills and filled embankments across the valleys.
Engineers still work this way. A planned highway or pipeline is drawn as a profile with a stated vertical exaggeration, and the parts where the line would be too steep stand out at once. The drawing lets them compare routes before any earth is moved.
A cross-section looks like a photograph of the land's side, so it is natural to judge steepness by eye. But almost every section stretches its heights, often ten or twenty times, to make small differences visible, and that makes every slope look far steeper than it is.
Read the vertical exaggeration printed beside the section, and work out real gradients from the heights and distances, not from the angle of the line on the page.
A section has $1$ cm for $500$ m across and $1$ cm for $25$ m up. Write the horizontal figure.
$500\ \text{m per cm}$
Across the page.
Write the vertical figure.
$25\ \text{m per cm}$
Up the page.
Divide across by up.
$\dfrac{500}{25} = 20$
The exaggeration.
Say what it means.
$\text{slopes look twenty times steeper}$
Heights stretched twenty times.
On a map with $1$ cm for $0.5$ km, a section line crosses the $200$ m contour at $3$ cm. Convert.
$3 \times 0.5 = 1.5\ \text{km}$
Ground distance.
It crosses the $250$ m contour at $6$ cm. Convert.
$6 \times 0.5 = 3\ \text{km}$
Ground distance.
Plot the two points.
$(1.5, 200),\ (3, 250)$
Height above distance.
Find the gradient between them.
$\dfrac{1500}{50} = 30$
One in thirty.
Say how it will look at ten times exaggeration.
$\text{about one in three}$
Ten times steeper.
A section has $1$ cm for $1000$ m across and $1$ cm for $50$ m up. Find the exaggeration.
$\dfrac{1000}{50} = 20$
Twenty times.
A real slope is one in $60$. Find its apparent steepness.
$\dfrac{60}{20} = 3$
One in three on paper.
Say what a reader might think.
$\text{a steep climb}$
From the picture alone.
Say what it really is.
$\text{a gentle slope}$
One in sixty.
Find the height gained over $3$ km.
$\dfrac{3000}{60} = 50\ \text{m}$
Run over sixty.
Name what should be printed.
$\text{vertical exaggeration } \times 20$
So the picture is read truly.
Write the two scales.
$250 \text{ and } 50\ \text{m per cm}$
Across and up.
Divide across by up.
$\dfrac{250}{50} = 5$
The exaggeration.
Say what it does.
A cross-section's horizontal axis has $1$ cm for $250$ m of ground, and its vertical axis has $1$ cm for $50$ m of height. What is its vertical exaggeration?
Complete the worked solution: a cross-section has $1$ cm for $500$ m across and $1$ cm for $50$ m up. A slope that is really one in $30$ is drawn on it. Find the vertical exaggeration and how steep the slope appears, as one in so many.
Find the exaggeration.
$\dfrac{\text{across}}{\text{up}} =$ e
How many times heights are stretched.
Find the apparent slope.
$\dfrac{\text{real one in}}{\text{exaggeration}} =$ a
One in this many on the paper.
Say why sections exaggerate.
$\text{real slopes would look flat}$
Heights are small beside distances.
Say what to print beside it.
$\text{the exaggeration}$
So readers can judge true steepness.
Match each cross-section shape to the landform it shows.
| a hill | a river valley | a plateau or mesa | a floodplain | |
|---|---|---|---|---|
| the line rises to a single high point and falls again | ||||
| the line dips into a narrow V | ||||
| the line climbs steeply, runs level, then drops steeply | ||||
| the line runs low and level for a long stretch |
On a map where $1$ cm stands for $0.5$ km, a section line crosses three contours at $4$ cm, $7$ cm and $10$ cm from its start. Fill in each crossing's ground distance in kilometers, ready to plot.
| distance | |
|---|---|
| first crossing (km) | |
| second crossing (km) | |
| third crossing (km) |
A cross-section's vertical axis starts at sea level and has $1$ cm for $25$ m of height. Write the height on the paper, in centimeters, of a point whose real height is $h$ meters.
Answer:
A cross-section shows a summit at $300$ m, $2$ km along the line, and a valley floor at $150$ m, $4$ km along. What is the average gradient between them, as one in so many?
Answer:
Suppose a cross-section of the Grand Canyon, Arizona, runs from a point on the rim at $6800$ feet to the Colorado River at $2576$ feet, $5$ miles away horizontally. What is the average grade from rim to river, in percent?
Answer: %
Read this unfamiliar schematic plan; north is up. The downstream route from A to B is 7 kilometers. | Position | West | East | |---|---|---| | North | A: broad trough, flow east | bend, flow south | | South | ridge | B: narrow stream, flow south | A has scratched bedrock and unsorted bouldery deposits. B has sorted gravel bars cut into those deposits. Mark every supported sentence in a landscape-history interpretation, including the limit of the record.
This task has no paper form; do it on a device.
Lesson test: one question per skill, one attempt each, no hints. Your answers are checked when you submit.
A cross-section's vertical axis starts at sea level and has $1$ cm for $50$ m of height. Write the height on the paper, in centimeters, of a point whose real height is $h$ meters.
Answer:
You can draw and read a cross-section. Explain why a slope on a section looks steeper than it really is.
25. Your turn: a section has $1$ cm for $250$ m across and $1$ cm for $50$ m up. What is its vertical exaggeration?, step 3
$\text{slopes look five times steeper}$
Heights are stretched.