Back to the on-screen lesson ·
A storm hydrograph tracks discharge from base flow up the rising limb to a peak and down again; its lag time and peak show how fast a basin floods.
Paper packet. Every task here also exists on screen, where it is checked automatically; answers written on paper are not assessed by Nydus. When you are back at a device, enter your answers there.
By the end of this lesson you will be able to read a storm hydrograph, find its lag time and peak rise, and explain why some basins flood faster than others.
You can calculate a river's discharge from a survey or read it from a gauge. This lesson follows the discharge hour by hour through a storm, and asks why some rivers flood quickly and others slowly.
| Term | What it means |
|---|---|
| Storm hydrograph | A graph of a river's discharge over time through a storm. |
| Base flow | The river's normal discharge, fed by groundwater, between storms. |
| Rising limb | The part of a hydrograph where discharge climbs toward the peak. |
| Peak discharge | The highest discharge a storm produces. |
| Recession limb | The part where discharge falls back after the peak. |
| Lag time | The time from peak rainfall to peak discharge. |
| Drainage basin | All the land that drains into a river and its tributaries. |
When rain falls on a drainage basin, most of it does not land in the river. It soaks into the soil, runs over the ground, or flows through the rock, and only then reaches the channel. So the river's discharge rises after the rain and peaks later.
A short lag and a high, steep peak mean a river that floods fast and hard.
Another way: picture
Picture pouring a bucket of water onto a sponge on a tilted board. At first the sponge soaks it up and little runs off; then water starts to drip from the low end, faster and faster, and keeps dripping after you stop pouring. A drainage basin is a huge, uneven sponge, and the river is the drip.
Another way: steps
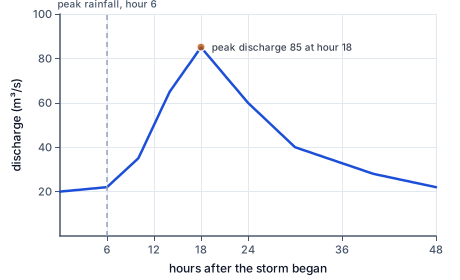
This invented river runs at a base flow of $20$ cubic meters a second. The heaviest rain falls at hour $6$; the discharge starts to rise a few hours later, climbs steeply to a peak of $85$ at hour $18$, and falls slowly back toward its base flow by hour $48$. The lag time is $18 - 6 = 12$ hours.
Rain reaching the ground can soak in, called infiltration, and then move slowly through the soil and rock as groundwater. It can run over the surface when the ground is paved, frozen, already soaked, or when rain falls faster than the soil can take it. Some is caught by plants and evaporates.
Surface runoff reaches a river in hours; groundwater takes days or weeks. The balance between them shapes the hydrograph.
A flashy river has a short lag time and a high, steep peak. A subdued river has a long lag and a low, gentle peak, because much of the rain soaks in and arrives slowly.
| Feature of the basin | Flashy | Subdued |
|---|---|---|
| slopes | steep | gentle |
| ground | paved, clay, bare rock | sandy soil, forest |
| size and shape | small, round | large, long |
| soil before the storm | already soaked | dry |
Steep slopes send water downhill fast. Clay soil and bare rock let little water soak in. A small, round basin brings all its water to the river at nearly the same time, while a long, narrow basin brings it in turn, from near and far.
Forests slow runoff: leaves catch rain, roots open channels in the soil, and leaf litter soaks water up. Clearing a forest usually makes a river flashier.
Roofs, streets and parking lots are impermeable: water cannot soak through them. Storm drains then carry the runoff straight to the nearest creek. So when a basin is built over, more of each storm's rain reaches the river, and it arrives far faster.
Urban creeks can rise within an hour of heavy rain, with peaks many times higher than before, and then drop almost as quickly.
Over a short stretch, the rising limb can be modeled as a straight line: base flow plus a steady rise per hour. A river at $20$ that rises $5$ cubic meters a second every hour reaches $20 + 5t$ after $t$ hours of rise.
The rate of rise, the whole rise divided by the hours it took, measures the limb's steepness. A steep limb is a warning: little time between the first rise and the flood.
After the peak, runoff from the surface stops arriving quickly, but water keeps draining from the soil and rock for hours or days. So the recession limb usually falls more gently than the rising limb climbed.
After a long wet spell the river may not return to its old base flow for weeks, because the groundwater has been topped up.
Checking an answer. A lag time must be positive: the river cannot peak before the rain. A rise above base flow must be smaller than the peak itself.
Measuring lag from peak to peak is allowed because it compares the same moment of each curve, the moment of greatest intensity, which is easy to find on both. Subtracting base flow isolates the storm's water from the water the river would have carried anyway.
Modeling the rising limb as a straight line is an approximation, allowed over short stretches where the rise is roughly steady.
The National Weather Service's river forecast centers use hydrographs to predict floods. They combine rainfall forecasts with models of each basin's soils, slopes and land use to predict the next hydrograph at every gauge, and issue flood warnings when a peak will top the banks.
For flashy urban creeks the warning time can be under an hour, which is why flash flood warnings urge people never to drive through flooded roads.
The most common slip is thinking a river peaks when the rain does, giving a lag of zero. Another is reading the lag time as the hour of peak discharge rather than the gap after the peak rainfall.
A third is forgetting to subtract base flow when finding how much extra water a storm brought. A fourth is reading a high peak as proof of heavy rain alone, when paved ground can raise peaks from ordinary storms.
Cities now try to slow runoff with green infrastructure: rain gardens, porous pavement that lets water through, green roofs, and ponds that hold storm water and release it slowly.
Each one lengthens the lag time and lowers the peak, making urban creeks behave a little more like the forested streams they once were.
Houston, Texas, sits on flat, clay-rich land crossed by slow bayous. Over decades, much of the prairie and wetland around the city was covered by streets, parking lots and homes, so rain that once soaked into the ground now runs quickly into the bayous.
In August 2017, Hurricane Harvey stalled over southeast Texas and dropped record rain, more than sixty inches at one gauge. Bayous rose faster and higher than many residents had ever seen, and tens of thousands of homes flooded, including some far from any mapped floodplain.
Hydrologists studying the storm found that paved ground had made the flooding worse, shortening lag times and raising peaks. Since then, Houston and Harris County have spent billions of dollars on detention basins that store storm water and release it slowly, deliberately lengthening the lag between the rain and the river's peak.
In the canyon country of Utah and Arizona, thunderstorms can drop heavy rain on bare rock and thin soil miles away from where hikers stand under clear skies. The water cannot soak in, so it runs off almost at once and funnels into narrow slot canyons.
These basins are among the flashiest in the country: a dry wash can become a roaring torrent within minutes, with a peak far above its normal flow, and fall back just as fast. The lag time can be so short that the flood arrives before the storm clouds are visible.
The National Park Service posts flash flood forecasts at the start of popular canyon hikes, such as the Narrows in Zion National Park, and closes them when storms threaten. The warning is a hydrograph's lesson in practice: in a basin with little to slow the water, the peak comes fast.
It seems natural that a river should be highest while the rain is heaviest. But almost none of the rain lands in the river itself: it must soak through or run over the ground first, which takes hours or days, so the river peaks later.
The length of that lag, and the height of the peak, depend on the basin: steep, paved or soaked basins give short lags and high peaks; gentle, forested or dry ones give long lags and low peaks.
The heaviest rain falls at hour $4$ and the river peaks at hour $10$. Find the peak rain's hour.
$4$
The earlier peak.
Find the peak discharge's hour.
$10$
The later peak.
Subtract the two values.
$10 - 4 = 6\ \text{hours}$
The lag time.
Judge the river.
$\text{fairly flashy}$
Only six hours.
A river rises from a base flow of $12$ to a peak of $48$ cubic meters a second. Find the rise.
$48 - 12 = 36$
Storm water.
The rise took $12$ hours. Find the rate.
$\dfrac{36}{12} = 3$
Per hour.
Write the rising limb.
$12 + 3t$
Base flow plus rise.
Check at the peak.
$12 + 3 \times 12 = 48$
The peak.
Say what a steeper limb would mean.
$\text{less warning time}$
Faster rise.
A creek's lag time was $14$ hours before its basin was built over. Record it.
$14\ \text{hours}$
Forest and fields.
After building, it is $5$ hours. Find the shortening.
$14 - 5 = 9\ \text{hours}$
Much faster.
Its peak rose from $30$ to $90$ cubic meters a second. Find how many times higher.
$\dfrac{90}{30} = 3$
Three times the peak.
Explain the change.
$\text{runoff from pavement and drains}$
Little soaks in.
Name a remedy.
$\text{rain gardens, detention ponds}$
Hold water back.
Say what they do to the hydrograph.
$\text{longer lag, lower peak}$
Less flashy.
Write the two hours.
$8 \text{ and } 24$
Peak rain and peak river.
Subtract the two values.
$24 - 8 = 16\ \text{hours}$
The lag time.
Judge the river.
During a storm, the heaviest rain falls at hour $4$ and the river reaches its peak discharge at hour $10$. What is the lag time?
Complete the worked solution: in a storm, the heaviest rain falls at hour $5$. The river, at a base flow of $10$ cubic meters a second, peaks at $55$ at hour $9$. Find the lag time and the peak's rise above base flow.
Find the lag time.
$\text{peak discharge hour} - \text{peak rain hour} =$ l
Hours.
Find the peak rise.
$\text{peak} - \text{base flow} =$ q
Cubic meters a second of storm water.
Say what a short lag means.
$\text{a flashy river}$
Water reaches it fast.
Name a cause of a short lag.
$\text{paved ground, steep slopes}$
Less water soaks in.
Match each part of a storm hydrograph to what it shows.
| the river's normal discharge between storms | the part where discharge climbs toward the peak | the part where discharge falls after the peak | the time from peak rainfall to peak discharge | |
|---|---|---|---|---|
| base flow | ||||
| rising limb | ||||
| recession limb | ||||
| lag time |
A storm hydrograph shows a river at $20$ cubic meters a second before a storm. Its discharge rises to a peak of $85$ at hour $18$, and the heaviest rain fell at hour $6$. Fill in the base flow, the peak discharge, the rise above base flow and the lag time.
| value | |
|---|---|
| base flow (m³/s) | |
| peak discharge (m³/s) | |
| rise above base flow (m³/s) | |
| lag time (hours) |
A river's base flow is $35$ cubic meters a second. Once storm water arrives, its discharge rises by about $8$ cubic meters a second every hour. Write the discharge on the rising limb as a function of the hours $t$ since the rise began.
Answer:
A river rises from a base flow of $8$ to a peak of $38$ cubic meters a second over $12$ hours. By how much did its discharge rise each hour, on average?
Answer: m³/s per hour
Suppose a creek on the edge of Atlanta, Georgia once had a lag time of $12$ hours. After its basin was covered by streets, roofs and parking lots, the same storm gives a lag time of $5$ hours. By how many hours did building over the basin shorten the lag?
Answer: hours
Lesson test: one question per skill, one attempt each, no hints. Your answers are checked when you submit.
A river's base flow is $8$ cubic meters a second. Once storm water arrives, its discharge rises by about $2.5$ cubic meters a second every hour. Write the discharge on the rising limb as a function of the hours $t$ since the rise began.
Answer:
You can read a storm hydrograph. Explain why building over a drainage basin shortens its river's lag time.
23. Your turn: rain peaks at hour $8$ and the river peaks at hour $24$. What is the lag time?, step 3
$\text{subdued}$
A long lag.