Back to the on-screen lesson ·
Redraw regions when questions change and test what aggregation conceals.
Paper packet. Every task here also exists on screen, where it is checked automatically; answers written on paper are not assessed by Nydus. When you are back at a device, enter your answers there.
Match extent, resolution and time period to a regional question, then justify changed membership.
All numerical investigations in this course are constructed classroom cases, not measured statistics for the named countries. Dates identify the imagined observation period. Use the supplied values to test an inference, not to describe a country's present conditions. Real geographic settings provide context; a calculation about a fictional sample cannot establish a national trend. Keep the source note with any table you copy.
Before comparing, identify the observation unit: a household, station, shipment, district or person. A denominator says which population could contribute to the numerator. Twenty served households out of forty is one half; twenty out of two hundred is one tenth. Equal counts therefore need not mean equal access. Missing observations are unknown, not zero. A sample selected near a road can miss people far from roads. Describe that coverage limit explicitly instead of attaching a confident regional label to an incomplete record.
| Term | What it means |
|---|---|
| Extent | The whole area investigated. |
| Resolution | The smallest distinguishable observation unit. |
| Aggregation | Combining observations into larger groups. |
| Catchment | Land draining toward a specified outlet. |
| Sensitivity | How a conclusion changes when an analytical choice changes. |
A boundary is part of an investigation's design. A province may be appropriate for allocating a provincial budget, but a drainage basin is often better for tracing material carried by a river. A commuter region may cross both. Choosing a scale means deciding the extent covered, the size of the observation units and the time period examined. These choices determine which differences remain visible. More detail is not automatically more useful: a continent-wide energy network needs broad coverage, while placing a pedestrian crossing requires street-level evidence. State the process before choosing the map, and revise the boundary when the process crosses it.
Another way: steps
Question → membership criterion → observations → boundary → sensitivity check.
Imagine a satellite image covering all of Africa. Its extent is continental, but its pixels could still be small. Conversely, a local district report can contain only one coarse average. Enlarging an image on a screen increases its display size without adding observations. For a flood question, broad coverage may identify rainfall upstream, while fine local elevation reveals which streets lie below a levee. Both are useful at different steps. Do not call one scale correct without specifying the question. Ask whether the study includes the causes and effects of interest, then ask whether its units are small enough to distinguish meaningful differences. A map can fail either test independently.
A drainage divide separates water flowing toward different outlets. A political border allocates authority. They need not coincide. A lake within one province may receive runoff from farms in two others. Restricting the investigation to the lakeside province omits potential sources, even if the provincial government commissioned the study. Draw the physical catchment for transport and retain administrative boundaries as an additional layer for responsibility. This produces an explanation that can connect environmental processes with institutions. It does not imply that natural boundaries should replace governments. Different boundaries answer different parts of the same practical problem, so a regional study may need several maps rather than one supposedly perfect outline.
For a commuting study, define membership with a measurable rule. Suppose a settlement belongs if at least forty percent of employed residents commute to Harbor. A settlement at fifty percent belongs; one at thirty percent does not. This rule creates a sharp analytical edge even though interaction changes gradually. Record whether home workers, seasonal workers and people with multiple workplaces enter the denominator. A daily count at a bridge cannot alone reveal workers' residence or destination. Use travel surveys or appropriately aggregated journey records. Then test another threshold. If changing forty to thirty-five percent adds many towns, the apparent size of the region is sensitive to the chosen criterion and should be reported as such.
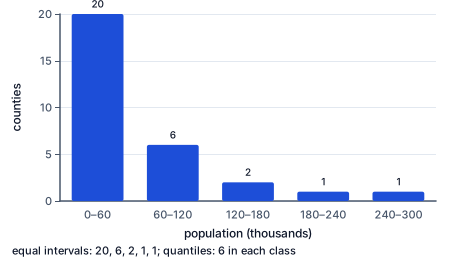
This shared chart uses thirty invented counties. The horizontal axis groups population into intervals of sixty thousand people; the vertical axis counts counties. Twenty counties occupy the lowest interval, six the next, two the third and one each the fourth and fifth. Thus two thirds of counties lie below sixty thousand people. That is not the share of people living in those counties: large counties contain more people. The histogram shows why giving every county equal weight differs from giving every resident equal weight. It also loses information within each interval, so it cannot supply an exact regional population. Read the textual alternative for the same counts, and keep the observation unit attached to every summary.
Equal district weights are appropriate only when the question gives equal importance to districts or when populations are equal. Suppose A serves twenty of one hundred households and B serves 240 of three hundred. Averaging twenty and eighty percent gives fifty percent, but the household share is 260 divided by 400, or sixty-five percent. More households live in the high-access district. Neither computation is inherently meaningless: one summarizes the average district share, the other the share of all households. The mistake is reporting the first as the second. Write the denominator in words before calculating. If original counts are available, summing numerators and denominators is usually the clearest way to combine access rates.
A market region can expand during a harvest or shrink when a bridge closes in winter. A one-day journey survey may describe that day accurately while missing the usual weekly pattern. Distinguish event duration, observation period and the period to which the conclusion applies. For comparing regions, survey similar seasons or explicitly examine seasonal differences. Northern and southern hemisphere calendars complicate comparisons: the same month may represent different growing conditions. Historical regional change also requires stable definitions. A town added to a metropolitan boundary can raise the metropolitan population without a single person moving. Separate boundary expansion from births, deaths and migration before explaining the change.
Imagine combining a wealthy suburb and a low-income industrial district. Their shared municipal average may look moderate, masking differences in pollution exposure and resources. Redrawing the boundary can change the apparent association between wealth and exposure even though no household changes. This is an aggregation problem. Do not infer an individual's circumstances from the average of a large area. Compare the result at more than one grouping and retain smaller units where privacy allows. Small units are not automatically unbiased either: they can produce unstable rates with very few observations. Report the counts behind the rates and explain why the chosen units are useful for the decision.
Write the original question beside the revised one. Identify exactly which membership criterion changes. List at least one place added and one excluded, giving evidence for each decision. Confirm that a new analytical boundary has not been confused with a legal boundary change. Recalculate summaries with the revised membership rather than reusing the old average. Finally ask whether the conclusion survives a reasonable alternative threshold or grouping. If it does, say which alternatives were tested. If it does not, explain the sensitivity rather than picking the most convenient map. A defensible redraw is reproducible: another learner using the stated rule and the same data should reach the same membership decisions.
A fictional regional clinic serves four towns. Their road distances are similar, but only two have morning buses. A planner draws a thirty-kilometer circle and proposes serving all four equally. A travel-time study reveals that the other two require overnight stays because the return buses leave too early. Redrawing the service area with the timetable changes the interpretation without moving the clinic. The planner records weekdays and weekends separately and asks about fares and mobility needs. The resulting functional region answers a practical access question. Administrative boundaries still matter for paying for new services, so they remain visible alongside the travel-time region. No one number, including distance, can substitute for the full journey.
A fictional reservoir receives runoff from three provinces. Ten monitoring sites near its shore show a concentration pattern, but cannot identify the upstream sources. Investigators extend the study to tributaries and repeat sampling before and after rain. They retain small subcatchments to distinguish possible source areas while covering the whole basin to avoid omitting external inputs. A province-wide annual average would hide short pulses entering after storms. The team reports which periods and tributaries were observed, and which were not. This design links spatial extent, spatial resolution and temporal sampling. Its map supports cooperation among authorities without pretending that a watershed outline alone decides legal responsibility or proves that one land user caused the observed pollution.
A detailed-looking outline can still rest on coarse observations. Display scale and measurement resolution are different. Likewise, the largest study area does not always supply the best explanation. Broad context can identify connections while local evidence shows unequal effects. Keep both when the process requires them; do not force a regional mean onto every settlement.
State the transport question.
Where does lake sediment originate?
The substance moves with runoff.
Identify the relevant pathways.
All upstream tributaries enter the lake.
Connected paths define possible sources.
Select the study extent.
Use the drainage basin.
A city outline would omit upstream land.
Retain a responsibility layer.
Show province boundaries separately.
Authority differs from physical transport.
Read the first count.
20 served of 100.
This district has a small population.
Read the second count.
240 served of 300.
This district has a larger population.
Combine the household counts.
20+240=260; 100+300=400.
Each household receives equal weight.
Calculate the regional share.
100*260/400=65%.
The denominator is all households.
Reject the unweighted shortcut.
(20+80)/2=50% describes district shares.
It does not describe the household population.
State the earlier criterion.
All towns within County C.
The old region served administration.
Define the new question.
Which towns supply Harbor's workforce?
The task concerns movement.
Set the membership threshold.
At least 40% commute to Harbor.
A reproducible rule is needed.
Apply the supplied shares.
P=60% belongs; Q=20% does not.
Each is compared with the same threshold.
Inspect an external town.
R=50% belongs despite lying outside C.
Functional connections cross borders.
Test a revised threshold.
At 55%, only P remains.
Membership is sensitive to the rule.
Choose the new criterion.
A journey of at most one hour.
Access depends on travel time.
Inspect the network data.
Include a distant rail town; exclude a nearby town behind a closed pass.
Straight-line distance is insufficient.
State the boundary limit.
A river crosses three provinces before reaching a lake. Which boundary best fits a study of upstream nutrient sources?
Two equally populated invented districts have access shares 30% and 70%. Find their combined share.
Identify the relevant quantities.
Average the two shares because their household populations are equal.
Keep numerator and denominator attached to the same observation unit.
Complete the missing calculation.
result
The operation summarizes the supplied case.
Interpret the result geographically.
Different population sizes would require weighting.
A numerical answer must retain its geographic scope.
A school changes its question from residence eligibility to daily travel access. Order the boundary redesign.
Number the steps in order (write the number in the box):
Match the scale problem to its remedy.
| Disaggregate to village observations | Extend coverage to the upstream basin | Extend the observation period | |
|---|---|---|---|
| One district mean hides village differences | |||
| Pollution enters from outside the city | |||
| Summer observations miss winter closures |
A new reservoir study replaces a county boundary with the upstream catchment. A tributary outside the county enters the reservoir; one county town drains elsewhere. Select both correct boundary decisions.
This task has no paper form; do it on a device.
Invented access data: district A has 31 served of 100 households; B has 220 served of 300. What percent of the combined 400 households is served?
Answer:
New reservoir dossier: the original study boundary is the county line. A drainage survey shows tributary T outside the county enters the reservoir, while town U inside the county drains to a different basin. The new question asks which surface-drainage areas could contribute reservoir nutrients; no concentrations were measured. Select all source-supported redraw decisions and limits.
This task has no paper form; do it on a device.
Lesson test: one question per skill, one attempt each, no hints. Your answers are checked when you submit.
Invented towns P and Q send 54 and 22 percent of workers to Harbor. Define its commuting region as towns sending at least 40 percent. The old county includes both. Select inclusion or exclusion for each town, and enter the number retained.
| Town P | Town Q | Number of retained towns | |
|---|---|---|---|
| Supplied comparison |
Explain why expanding a study area and making its data finer are different operations.
19. Redraw for a hospital, step 3
The region describes this timetable and season.
Services and roads can change.