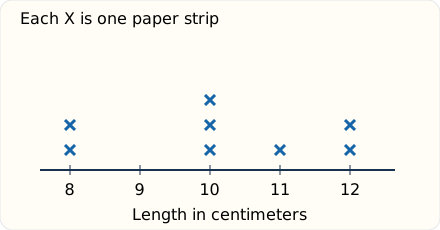
One mark for each measurement, stacked above its value.
Paper packet. Every task here also exists on screen, where it is checked automatically; answers written on paper are not assessed by Nydus. When you are back at a device, enter your answers there.
1. What you will learn
In this lesson you make a line plot: measure things, then put one mark above the number for each one. It looks like a bar chart lying down and it is not — the bottom is a number line, so the gaps between the values matter, and a value nobody measured still has its place with nothing above it. That last part is what a line plot shows and a bar chart hides.
2. Measurements become data
A ruler uses equal length units. If a strip begins at zero and ends at ten centimeters, its length is ten centimeters. When you measure several strips, you collect data: recorded information about those strips. Some may have the same length. A line plot keeps every measurement while grouping equal measurements together. We will use lengths measured to whole centimeters. Read cm as centimeters, and keep that unit with the numbers so that another reader knows what was measured.
3. Words for a line plot
Term
What it means
data
Recorded observations or measurements.
line plot
A number line with one mark above a value for each observation of that value.
frequency
How many observations have a particular value.
scale
The ordered values and equal spacing used along the line.
key
An explanation of what each plotted mark represents.
4. One measurement, one mark
This plot records eight paper-strip lengths. Two strips measured eight centimeters, no strip measured nine, three measured ten, one measured eleven, and two measured twelve. Each X stands for one strip. Equal lengths share a position on the number line, so their X marks stack upward. A stack does not represent one very long strip. It records several strips with the same measured length.
Two questions need different readings. How many strips were ten centimeters long? Count the three X marks above ten. Which length was recorded most often? Find the tallest stack, then read its length label: ten centimeters. Three names a number of strips; ten centimeters names a length. Before answering, say which kind of quantity the question asks for. The plot's key and axis label make that distinction visible.
Another way: table
Strip length in cm
Number of strips
8
2
9
0
10
3
11
1
12
2
The table and plot describe the same observations. The zero row is kept so that the consecutive scale stays clear.
5. Make a record before drawing
Suppose you measure five short ribbons and record 6, 8, 6, 7 and 8 centimeters. Keep each result, including repeated values. The two sixes belong to two ribbons; deleting one because it repeats would erase a measurement. You may number the ribbons so that you know which ones have already been measured. This also helps if you need to check an unexpected result.
Find the smallest and largest recorded lengths. Here they are six and eight centimeters, so a number line from six through eight covers all the observations. Label the intermediate seven too. Use equal spaces because the difference from six to seven is the same one-centimeter amount as the difference from seven to eight. Write Length in centimeters below the line. Add a key saying that each X is one ribbon. A title can say what collection was measured.
Then read the record one entry at a time. For six, draw an X above six. For eight, draw one above eight. The next six needs another X above the first six mark. Continue until every recorded length has one mark. Cross off or check each entry in your list after plotting it. This is a useful one-to-one check: each ribbon, one record; each record, one plotted X. It prevents both skipped and repeated entries.
6. Keep empty positions on the number line
The teaching plot has no mark above nine, yet nine still has a labeled position. An empty stack means that none of these measured strips was recorded as nine centimeters. It does not mean nine centimeters is an impossible length. It also does not mean that the axis should jump directly from eight to ten with the same spacing used for other one-unit gaps.
Imagine erasing the nine label and moving ten into its place. The printed distance from eight to ten would then look like the same numerical change as the printed distance from ten to eleven. But one difference is two centimeters and the other is one. A line plot's horizontal spacing represents number differences, so that rearrangement would be misleading. You may leave a label unprinted on some graphs if the scale remains clear, but the value's position still exists.
This is one difference between a line plot and a picture graph of categories. In a graph of favorite colors, blue and red are category names; there is no numerical distance from blue to red. Their order can be changed without changing the counts. In a length plot, the numbers must keep their order and equal unit spacing. Choose the display to match the question. A numerical measurement distribution is a natural job for a line plot. Comparing named categories is often clearer with a picture or bar graph.
7. Read counts and lengths separately
On the teaching plot, the stack at eight contains two marks. That means two strips were eight centimeters long. It does not mean the strips were two centimeters long. The number under the stack gives the measured length; the number of marks gives how often that length occurred. Point to the axis when you name a length and to the X marks when you name a count. This small habit helps keep the two meanings apart.
To find the total number of measured strips, count every X once. You can combine stack counts: 2 + 0 + 3 + 1 + 2 = 8. Adding the axis labels instead would combine lengths, not count observations. Even multiplying a label by its frequency would answer a different question about combined length. Do the operation that matches the question you were actually asked.
To compare two frequencies, subtract their counts. Three strips measured ten centimeters and one measured eleven, so two more strips measured ten than eleven. To compare two lengths, subtract the length values. Twelve centimeters is four centimeters longer than eight. Both questions use subtraction, but the numbers and answer units differ. Write two more strips for the frequency comparison and four centimeters longer for the length comparison. A correct numeral with the wrong unit can still communicate the wrong idea.
8. Use all the recorded evidence
The tallest stack tells you a most common recorded value. In the teaching plot that value is ten centimeters, with three observations. It is not automatically the longest length. The longest recorded length is twelve centimeters, at the rightmost occupied position. The shortest recorded length is eight, at the leftmost occupied position. Read occupied positions rather than assuming that the ends of a drawn axis must contain data.
A new plot could have two equally tall largest stacks. Then both values are tied for most common. Do not choose one just because it appears farther right or because you like a tidy single answer. The data can support more than one most common value. Another collection might have every length once; the plot would then show a tie across all recorded values. Explain what the plot shows instead of forcing a pattern.
Questions about at least or at most require attention to the boundary. At least ten centimeters includes ten, eleven and twelve in this plot, so there are 3 + 1 + 2 = 6 strips. More than ten excludes the ten-centimeter strips and leaves three strips. The phrase at least includes equality. Mark the included scale positions before counting their X marks if the wording is easy to mix up. The result should never exceed the total number of strips.
9. Check the plot and its limits
A plot needs to agree with the original record. First count the list entries and the X marks. Those totals should match. Next inspect each value: if the record contains three tens, the plot should have exactly three X marks above ten. A total check alone is not enough, because one mark could be moved to the wrong position while the total stays unchanged. Check both the overall count and the count at each position.
Then check the labels and spacing. Are lengths measured in the same units? Are the numbers in order? Do equal number differences have equal spaces? Is the key clear about what an X represents? A stack of marks without a unit label could be misunderstood as inches, centimeters or something else. If measurements used different units, convert or organize them appropriately before putting them on one shared scale. Our classroom records here already use one common unit.
Finally, keep the conclusion about the collection that was measured. Eight paper strips do not tell you the lengths of every strip in the school. A plot also does not explain why a strip has a certain length. Perhaps someone cut it, folded it or selected it from a box. Those are possible stories, not facts supplied by the marks. A useful conclusion states the observed pattern and names the measured collection. A new question may require collecting new data.
10. Organizing strips for a craft
An invented classroom in Vermont measures eight paper strips before making a border. Its line plot is the teaching figure. A group needs strips at least ten centimeters long. The three ten-centimeter strips qualify, as do the one eleven-centimeter strip and the two twelve-centimeter strips. There are six eligible strips. The two eight-centimeter strips are too short. Checking six eligible plus two ineligible gives all eight measured strips. If the instruction changes to longer than ten centimeters, only three qualify. The wording changes the boundary, even though the data have not changed. A line plot makes it possible to see which observations lie on each side of that boundary while retaining repeated measurements.
11. Checking a measuring routine
A class measures six pencils to the nearest whole centimeter and records 9, 9, 10, 12, 12 and 12. Before plotting, a partner checks that each pencil was measured once and that the ruler began at zero. The number line includes nine, ten, eleven and twelve. There will be two marks above nine, one above ten, none above eleven, and three above twelve. The empty eleven-centimeter position belongs on the scale because it preserves equal numerical spacing. Counting 2 + 1 + 0 + 3 confirms six pencils. If someone draws a mark above eleven by mistake, the total could still be six, so a second check compares each stack with the original record. A clear plot depends on accurate collection as well as neat drawing.
12. Avoid mixing the two kinds of numbers
The tallest stack is not the longest object. It is the length that occurred most often. A blank scale position means zero observations there; it does not mean the number should be removed from the scale. Several identical measurements need several marks. Keeping only one copy erases information about the collection. When asked how many objects, count X marks. When asked which length, read the number and unit under the relevant stack. When two stacks tie, say so. A plot is a record of evidence, and a careful reader should preserve its repeated values, gaps and ties rather than replacing them with a neater story.
13. Count observations
Read what a mark means.
Each X is one paper strip.
The key sets the counting unit.
Count the first two stacks.
2 + 0 = 2 strips.
The empty position adds no observation.
Add the middle stack.
2 + 3 = 5 strips.
All three ten-centimeter strips must be counted.
Add the remaining stacks.
5 + 1 + 2 = 8 strips.
Every plotted mark is included once.
State the measured total.
8 paper strips were measured.
The result is a count, not a length.
14. Compare frequency and length
Read the ten-centimeter frequency.
3 strips at 10 cm.
Count X marks at that scale position.
Read the eleven-centimeter frequency.
1 strip at 11 cm.
The axis label and stack height have different meanings.
Compare the frequencies.
3 - 1 = 2 more strips.
This difference compares counts.
Find the extreme lengths.
Shortest 8 cm; longest 12 cm.
Use the leftmost and rightmost occupied positions.
Compare those lengths.
12 - 8 = 4 cm.
This difference compares measurements.
Check the answer labels.
2 strips and 4 cm answer different questions.
Units preserve the meaning of each subtraction.
15. Build and audit a new plot
Keep the complete record.
6, 8, 6, 7, 8 cm.
Repeated values still represent different ribbons.
Choose a sufficient scale.
6, 7, 8 with equal spacing.
The scale covers all measured values in one-centimeter steps.
Plot the six-centimeter ribbons.
Two X marks above 6.
There are two sixes in the record.
Plot the other ribbons.
One X above 7 and two above 8.
Each remaining record gets one mark.
Count all plotted observations.
2 + 1 + 2 = 5 ribbons.
The plot total matches the five records.
Find the most common values.
6 cm and 8 cm are tied.
Both stacks have the largest count of two.
Check the conclusion's scope.
The tie describes these five ribbons.
It does not establish a pattern for every ribbon elsewhere.
16. Your turn: a plot has one mark at 4 cm, three at 5 cm and two at 6 cm
Read the stack counts.
1, 3 and 2 observations.
The key says one mark per object.
Find the total count.
1 + 3 + 2 = 6 objects.
Every mark represents a measured object.
Your turn: work this step out. Its working is at the end of the packet.
Find the most common length.
Your turn: work this step out. Its working is at the end of the packet.
Check the length spread.
17. Guided practice
A line plot of pencil lengths has 5 X marks above 13 cm, 4 above 14 cm and 1 above 15 cm. How many pencils were measured?
Answer:
18. Guided practice
A plot has 2 marks at one length, 3 at the next length and 2 at the next. Find the number of objects.
Identify the counting unit.
One mark stands for one object.
The key tells us what to count.
Combine all stack counts.
There are total objects.
Every recorded object needs one mark.
Check the kind of answer.
Report a count of objects, not a length.
The horizontal labels answer a different question.
19. Guided practice
A line plot of pencil lengths has 7 X marks above 12 cm, 4 above 13 cm and 3 above 14 cm. Which length has the most pencils? Give the length in centimeters.
Answer:
20. Practice
A line plot of pencil lengths has 3 X marks above 10 cm, 6 above 11 cm and 2 above 12 cm. How many pencils were measured?
Answer:
21. Practice
A line plot of pencil lengths has 1 X marks above 15 cm, 2 above 16 cm and 6 above 17 cm. Which length has the most pencils? Give the length in centimeters.
Answer:
22. Practice
A line plot of pencil lengths has 5 X marks above 11 cm, 3 above 12 cm and 2 above 13 cm. How many pencils were measured?
Answer:
23. Somewhere new
A line plot has X marks above 14 cm, above 15 cm and above 18 cm. What is the difference between the longest pencil and the shortest one?
difference centimeters
24. Somewhere new
A class wants to display six short pencil lengths, measured to whole units: 6, 6, 7, 9, 9, 9. Select every defensible planning statement. The purpose is to show how often each length occurred, not favorite pencil colors.
This task has no paper form; do it on a device.
25. Lesson test
Lesson test: one question per skill, one attempt each, no hints. Your answers are checked when you submit.
26. Test question
Prepare a line plot for this record of six lengths in centimeters: 9, 12, 9, 10, 12, 12. Complete the frequency table that tells how many X marks belong at each position.
Number of X marks
9 cm
10 cm
11 cm
12 cm
27. What you can do now
You can make and read a line plot. Without looking: what does it mean if a number on the line has no marks above it?
Working for the steps left to you
16. Your turn: a plot has one mark at 4 cm, three at 5 cm and two at 6 cm, step 3
5 cm.
The tallest stack is above five.
16. Your turn: a plot has one mark at 4 cm, three at 5 cm and two at 6 cm, step 4
6 - 4 = 2 cm.
Compare the occupied extreme values, not the tallest stack.
 This plot records eight paper-strip lengths. Two strips measured eight centimeters, no strip measured nine, three measured ten, one measured eleven, and two measured twelve. Each X stands for one strip. Equal lengths share a position on the number line, so their X marks stack upward. A stack does not represent one very long strip. It records several strips with the same measured length.