Read picture graphs and bar graphs, including a key worth more than one, and read measurements from a line plot.
Paper packet. Every task here also exists on screen, where it is checked automatically; answers written on paper are not assessed by Nydus. When you are back at a device, enter your answers there.
1. What you will learn
In this lesson you read picture graphs and bar graphs, work out totals and differences from them, and read a line plot of measurements. By the end you can explain why four pictures are not always four things.
2. Organize a count so others can check it
You can sort objects into groups and compare whole-number counts. A graph records those counts in a visual form. We will build and read picture graphs and bar graphs with up to four categories, beginning with one picture or one scale interval for each object. We will also connect these displays to line plots of measurements and distinguish what each kind of graph shows.
3. Words for a data display
Term
What it means
category
A named group used to sort the records.
frequency
The number of records in a category or at a measurement value.
key
A statement telling how much one picture represents.
bar graph
A display whose bar lengths represent category counts on a common scale.
line plot
A number line with a mark for each measurement at its value.
4. Labels and scale give a graph meaning
The classroom supply graph records sixteen votes: five for crayons, three for markers, six for pencils and two for erasers. Every bar begins at zero. Each equal interval on the count axis means one vote. The longest bar belongs to pencils, while its endpoint six tells how many votes pencils received. The category name and the count answer different questions, so read both before reporting a result.
Another way: table
Supply choice
Votes
Crayons
5
Markers
3
Pencils
6
Erasers
2
5. Collect and organize records fairly
Start with a clear question, such as Which one of these four supplies would you choose for the project? If every learner chooses exactly one category, each response belongs in one row. Record every response once. A table or tally list can help you count before drawing the graph. The total category count should match the number of responses collected.
Category labels should be clear enough that another person can sort a response in the same way. If the choices are crayons, markers, pencils and erasers, a vote for pencils should not be placed in the markers row. If someone gives two choices when the rule asks for one, resolve that record before counting it as though it were one ordinary response. The collection method affects what the graph means.
A zero category still carries information. If nobody chooses erasers, show an erasers label with zero pictures or a bar of length zero. Omitting the category may make readers wonder whether it was offered at all. A complete display keeps the stated choices visible, even when their counts are zero.
Write a title that names the question or collection. Classroom supply choices is more useful than Graph because it tells the reader what the categories describe. If the responses come from one class on one day, do not claim that the result tells what all children everywhere prefer. A graph summarizes the records you actually collected, within the stated scope.
6. Build a single-unit picture graph
For a picture graph with a key of one square equals one vote, draw one square for each recorded vote. Five crayon votes require five squares in the crayons row. Keep all symbols the same size and align the starting positions of the rows. Then readers can compare row lengths fairly as well as count the symbols.
The key belongs beside the graph. Without it, a row of five pictures could represent five objects, ten objects or another amount. In the main Grade 2 work, use a one-unit key so each picture directly represents one record. A title, category labels and the key together explain what is counted and how to read it.
Spacing should help reading without suggesting extra records. A gap between two pictures is not an uncounted object. However, making one row's pictures much farther apart could make it appear larger than another row with more pictures. Use consistent spacing and count the actual symbols to check the impression. Decorative size and color should not replace the stated key.
After drawing, compare the picture count in each row with the source table. Then add all rows and compare with the total number of records. This catches a skipped symbol, a repeated response or a category accidentally left out. A graph is a representation of the data; its appearance should be checked against the original counts rather than trusted because it looks neat.
7. Build and read a single-unit bar graph
A bar graph uses a continuous bar instead of separate pictures. Begin a count axis at zero and mark equal intervals of one. Use the same scale for every category. Draw bars with equal thickness and make their lengths reach the recorded counts. Category order can vary, but each bar needs a clear label and the same baseline.
For the supplied graph, the crayons bar reaches five. The markers bar reaches three, the pencils bar six, and the erasers bar two. Count the intervals from zero to an endpoint if you are unsure. Do not count the printed tick marks as though each were a vote; zero is the starting position and contributes no vote.
Bars can run horizontally or vertically. On a horizontal graph, the count is read across; on a vertical graph, it is read upward. The meaning is still the bar's length from zero on its count scale. Read axis labels rather than relying on a particular orientation. A wider bar is not meant to represent more unless the graph explicitly uses a different kind of display, which ours does not.
An unequal scale would mislead. If the space from zero to one were small but the space from five to six were very large, a one-vote increase near six would look much bigger. Equal numerical steps need equal drawn intervals. A graph that starts its bars at different baselines also makes direct length comparisons unreliable. Check those features before using the picture as evidence.
8. Answer totals, differences and missing amounts
Different questions require different operations. How many votes altogether asks for the sum of all category counts. In the supply graph, 5 + 3 + 6 + 2 = 16. How many votes for pencils asks only for that bar's count, six. How many more votes for pencils than markers asks for the gap, 6 - 3 = 3. Giving six for that last question names the larger group but does not compare it with the smaller.
A put-together question may include only selected categories. Crayons and markers together have eight votes, from 5 + 3. Do not include pencils and erasers if the question asks only about those two categories. Point to the required rows before calculating and name which records are being combined.
A missing-count question uses the known total. If sixteen learners voted and the first three categories have five, three and six votes, those categories total fourteen. The remaining category must have two votes. Check that fourteen plus two returns sixteen. This reasoning assumes every learner's vote belongs in exactly one of the four categories and no responses were omitted.
Two categories can tie. Equal-length bars on the same scale mean equal counts, so a question about the most common category may have more than one answer. Inspect every row before naming a winner. A graph can also show a smallest count of zero. Read the numerical evidence instead of assuming that every category must have at least one picture.
9. Connect picture keys and measurement plots
Some extension practice uses a picture key worth more than one. If one picture means two books, four pictures represent eight books. Count two, four, six, eight or add two four times. The number of pictures and the number of books are different quantities. A row for eight books under that key needs four pictures, not eight. Keep the key visible while calculating.
Changing the key without changing the pictures changes the represented count. Four symbols with a one-book key mean four books; the same four symbols with a two-book key mean eight. If you want to redraw the same eight-book data with the smaller key, you need eight symbols. The displayed symbol count must adjust when the value per symbol changes.
A line plot answers a different organizing question. Instead of categories such as crayons and pencils, its horizontal positions are numerical measurements, such as lengths in centimeters. Each X represents one measured object, and repeated measurements stack above the same number. Equal distances along the number line represent equal changes in measured length. An empty value between occupied values should remain in its correct position.
In a line plot, the tallest stack identifies the most frequent measurement, not the longest measurement. A stack of five X marks at eight centimeters says five objects measured eight centimeters. The longest measurement is the greatest occupied value on the horizontal scale. Distinguish the number of marks from the value under them, just as you distinguish a picture count from the key's represented amount.
For an integrated classroom record, also keep time and shares separate from frequencies. A display may be prepared at 2:35 p.m., using a poster split into two equal-area regions. The clock's long hand at seven represents thirty-five minutes; it does not represent seven votes. Two regions covering six equal squares each in a twelve-square poster are halves; they do not automatically tell how many learners voted. Each representation has its own whole, unit or scale. A sound explanation names that reference before drawing a conclusion.
10. Plan supplies from a class vote
Sixteen learners choose one supply category each: five choose crayons, three markers, six pencils and two erasers. A group builds a single-unit bar graph and labels its axis Votes. The graph shows that pencils received three more votes than markers and that crayons plus markers received eight votes altogether. It does not say how many individual pencils need to be purchased, because a vote is a preference rather than a supply quantity. The class should use a separate plan for the number of items each learner needs. This distinction keeps an accurate graph from being used to answer a question its data do not support.
11. Check a measurement display
A class measures paper strips and obtains lengths of eight, eight, ten, ten, ten and twelve centimeters. A line plot places two X marks at eight, three at ten and one at twelve, with the empty nine- and eleven-centimeter positions kept on the equal scale. Six marks confirm that every strip is included. Ten centimeters is the most frequent length, while twelve centimeters is the longest. A category graph of favorite paper colors would answer a different question and could not show the gaps between lengths. The class chooses its display according to what was recorded and what readers need to compare, then checks the plotted counts against the original list.
12. Read the reference for every display
A key may make one picture worth several records, so symbol count is not always object count. A bar's category and its endpoint answer different questions. A tallest line-plot stack indicates frequency, not greatest measured length. Graph conclusions describe the supplied collection; they do not establish facts about people or objects that were never included.
13. Read one bar and compare two
Read the title and unit.
The graph records classroom supply votes.
The bars count responses, not physical supplies.
Check the scale.
One interval represents one vote.
All bars share the same zero baseline.
Read the two categories.
Pencils has 6 votes and markers has 3.
The endpoint values give the frequencies.
Find the difference.
6 - 3 = 3 votes.
How many more asks for a gap.
Check the comparison.
3 + 3 = 6.
The smaller count plus the gap recovers the larger.
14. Reconstruct a missing category
Read the collection rule.
16 learners each chose one of four categories.
Every response belongs in exactly one row.
Record the known counts.
Crayons 5, markers 3, pencils 6.
The erasers count is missing.
Combine two known rows.
5 + 3 = 8.
Both categories belong to the recorded subtotal.
Include the third known row.
8 + 6 = 14.
Fourteen responses are already accounted for.
Find the missing count.
16 - 14 = 2 eraser votes.
The remainder completes the collection.
Verify all four rows.
5 + 3 + 6 + 2 = 16.
The category counts reproduce the total responses.
15. Repair a changed picture key
Read the original data.
A collection contains 12 books.
The book count must remain fixed.
Read the proposed key.
One picture represents 3 books.
The pictures now group books in threes.
Test the proposed row.
A learner draws 12 pictures.
This copies the book count without using the key.
Find what that row would mean.
12 groups of 3 would represent 36 books.
The displayed amount is too large.
Construct the correct row count.
3 + 3 + 3 + 3 = 12, so use 4 pictures.
Four equal groups represent the actual collection.
Check a second key.
With a one-book key, use 12 pictures.
Smaller symbol values require more symbols for the same data.
State the fixed quantity.
Both correct displays represent the same 12 books.
The data stay constant while their representation changes.
16. Finish a category comparison
Read the category counts.
A class records 9 walkers and 6 bicycle riders.
Each learner appears in one group.
Identify the question.
How many more walkers than bicycle riders?
The required result is a difference.
Your turn: work this step out. Its working is at the end of the packet.
Calculate the gap.
Your turn: work this step out. Its working is at the end of the packet.
Check the larger count.
17. Guided practice
In a picture graph of apples sold, the key says that each picture stands for 4 apples. Monday's row has 5 pictures. How many apples were sold on Monday?
Answer:
18. Guided practice
A survey has 14 responses in three categories. Two category counts are 3 and 6. Find the third.
Combine the known categories.
3 + 6 = 9.
Each response belongs to exactly one category.
Find the uncounted responses.
14 - 9 = missing.
The missing row completes the stated total.
Check all three categories.
Known counts plus the missing count must return the total.
No response may be omitted or counted twice.
19. Guided practice
A bar graph shows 3 cats, 5 dogs and 4 fish. Fill in both blanks.
there are t pets altogether, and d more dogs than cats
20. Practice
In a picture graph of apples sold, the key says that each picture stands for 5 apples. Monday's row has 4 pictures. How many apples were sold on Monday?
Answer:
21. Practice
A bar graph shows 7 cats, 15 dogs and 2 fish. Fill in both blanks.
there are t pets altogether, and d more dogs than cats
22. Somewhere new
In a picture graph each picture stands for 4 books. Which row shows 12 books?
3 pictures
12 pictures
7 pictures
23. Somewhere new
A class recorded 5 votes for drawing, 3 for reading, 2 for puzzles, and zero for singing. One absent classmate returns and votes for singing. Redraw the picture graph with one picture per vote. Record the new number of singing pictures, the unchanged number of reading pictures, and the total votes now shown.
Singing pictures
Reading pictures
Total votes
Updated graph record
24. Lesson test
Lesson test: one question per skill, one attempt each, no hints. Your answers are checked when you submit.
25. Test question
A class has 13 votes: 7 for crayons, 2 for markers, 3 for pencils and the rest for erasers. Complete a plan for a bar graph using one interval per vote. Record the eraser bar's endpoint, the crayons-plus-markers total and how many more crayon votes than marker votes there are.
Eraser bar endpoint
Crayons + markers
Extra crayon votes
Graph planning record
26. What you can do now
You can read a picture graph with a key, add and compare the rows of a bar graph, and say how many things a line plot shows and which measurement was commonest.
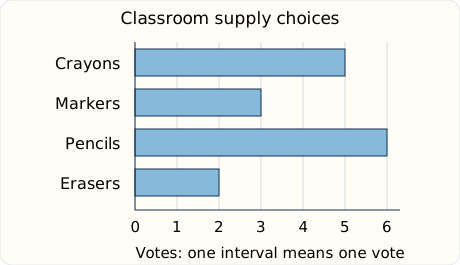 Every bar begins at zero. Each equal interval on the count axis means one vote. The longest bar belongs to pencils, while its endpoint six tells how many votes pencils received. The category name and the count answer different questions, so read both before reporting a result.