Back to the on-screen lesson ·
Center, spread and shape, and the values that sit apart from the rest.
Paper packet. Every task here also exists on screen, where it is checked automatically; answers written on paper are not assessed by Nydus. When you are back at a device, enter your answers there.
In this lesson you describe a set of data by its center, its spread and its shape, and you notice values that sit far away from the rest. You read dot plots, count their values, find the range and the middle value, and name the shape: symmetric, skewed, or split into clusters. Three things instead of one number, because a single average hides whether the data is tightly bunched or all over the place.
You can put numbers in order from least to greatest and place them on a number line. You can subtract to find how far apart two numbers are. You have read bar graphs and tally charts, where a taller bar means more of something. In this lesson those skills come together to answer a new kind of question: not 'what is the answer?' but 'what do all the answers look like together?'
| Term | What it means |
|---|---|
| Statistical question | A question you expect to get different answers to, such as 'How many hours do sixth graders sleep?' |
| Data | The answers you collect, one value for each person or thing you asked about. |
| Distribution | How the values of a data set are spread out: which values occur and how often. |
| Dot plot | A number line with one dot stacked above a value for each time that value occurs. |
| Center | A single value that is typical of the data, near its middle. |
| Spread | How far the values reach and how much they differ from each other. |
| Range | The highest value minus the lowest value. |
| Cluster, gap and peak | A cluster is a group of values bunched together, a gap is an empty stretch with no values, and a peak is the tallest stack. |
| Outlier | A value much higher or lower than the rest of the data. |
| Symmetric and skewed | Symmetric data has two halves that mirror each other; skewed data has a long tail on one side. |
Ask one student 'How many books did you read this summer?' and you get one number. Ask the whole class and you get a pile of numbers that are not all the same. A question like that, one you expect to get different answers to, is a statistical question. The collection of answers is the data, and the way the answers are spread along the number line is the distribution.
'How tall is Maya?' is not a statistical question: it has one answer. 'How tall are the students in Maya's class?' is, because heights vary from student to student. The variety is the whole point. Statistics is the study of data that varies.
You describe a distribution with three things:
One number alone is never enough. Two classes can both have a middle score of 7 out of 10, but in one class every student scored 6, 7 or 8, and in the other the scores run from 1 to 10. Those classes need very different teaching, and only the spread and the shape tell you so.
Another way: picture
Picture a dot plot as a row of stacked coins on a ruler. Each coin is one answer, placed above its value. Step back and you see a skyline: a tall tower where many answers agree, low buildings where few do, empty lots where nobody answered, and maybe one lonely tower far down the street. Describing a distribution is describing that skyline.
Another way: hands on
Ask ten friends how many letters are in their first name. Draw a number line from 2 to 12 and put one sticky note above the right number for each answer, stacking notes that land on the same number. Then say where the stack is tallest, how far the notes reach, and whether any note sits by itself.
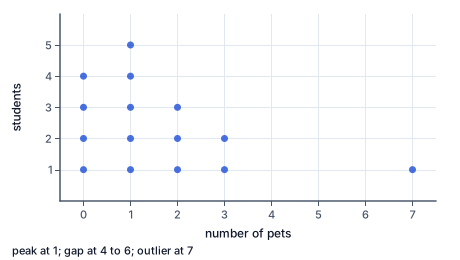
A dot plot is a number line with a dot for each value. When a value comes up more than once, the dots stack. Here are the numbers of pets owned by 15 students, as a count of dots above each value:
| Pets | 0 | 1 | 2 | 3 | 4 | 5 | 6 | 7 |
|---|---|---|---|---|---|---|---|---|
| Dots | 4 | 5 | 3 | 2 | 0 | 0 | 0 | 1 |
To read it, ask four questions in order. How many values? Add the stacks: $4 + 5 + 3 + 2 + 1 = 15$. Where do they reach? From 0 up to 7, so the range is $7 - 0 = 7$. Where do they pile up? The tallest stack, the peak, is at 1 pet. Is anything unusual? Nobody has 4, 5 or 6 pets, and then one student has 7. That empty stretch is a gap, and the lone value past it is an outlier.
Every dot is one student, so a stack of 5 dots means five students gave the same answer. A dot plot never loses a value: you can read every single answer back from it. That makes it the best picture for a small set of data, up to about thirty or forty values.
Here is the same pets data drawn as a dot plot. Read it the way you read the table, but now the shape jumps out. Look at the left side first: the dots pile up at 0, 1, 2 and 3 pets, and the tallest stack, 5 dots, is at 1 pet. That is the peak. Next, follow the number line to the right. Above 4, 5 and 6 there are no dots at all; that empty stretch is the gap. Past it, one dot stands alone at 7 pets. It is far from every other value, so it is an outlier. Finally, count the dots to check that nothing is missing: $4 + 5 + 3 + 2 + 1 = 15$, one dot for every student. The distribution is piled up on the left and has a long, thin tail to the right, which is why the typical student owns only one or two pets even though somebody owns seven.
The center is a single number that stands for the whole data set. In later lessons you will calculate two careful centers, the mean and the median. For now, one good way to find a center is to find the middle value: put all the values in order and take the one in the middle position.
With an odd number of values, the middle position is the count plus one, divided by two. For 15 values it is $(15 + 1) \div 2 = 8$, the 8th value. On a dot plot you do not have to write the list out. Count dots from the left, one stack at a time. In the pets data the first stack has 4 dots, and the second brings the count to $4 + 5 = 9$. The 8th dot is in the second stack, so the middle value is 1 pet.
With an even number of values there are two middle values, and the center is halfway between them. A center describes the data only when the data has one main pile. If the values split into two clusters, the middle may fall in the gap, where no value is at all. Then it is more honest to describe each cluster on its own.
The simplest measure of spread is the range, the highest value minus the lowest. A small range means the values are close together; a large range means they differ a lot. Because the range uses only the two end values, one outlier can stretch it a long way. Five plant heights of 20 to 22 centimeters have a range of 2, but add a plant of 34 centimeters and the range jumps to 14, though nothing changed for the other five.
Shape describes the outline of the dot plot.
Name a skew by its tail, not by its pile. 'Skewed right' means the tail points right, even though most of the data is on the left.
An outlier is a value that sits far away from the rest. On a dot plot it is easy to spot: a lone dot on the far side of a gap. There is no single rule for 'far' at this grade; a value that is clearly separated from every other value, by a gap wider than the cluster itself, is a good sign.
Finding an outlier is only half the job. The other half is asking why it is there. Sometimes it is a mistake: a student typed 80 hours of sleep instead of 8. Then you fix it or leave it out. Sometimes it is real and interesting: a bus that was 40 minutes late on the day a road was closed. Then you keep it, but you say what caused it, and you may describe the data both with and without it. Never throw away a value just because it is inconvenient. The outlier might be the most important fact in the data.
To describe a distribution:
To check:
Old Faithful in Yellowstone National Park is famous for erupting again and again. A well-known record used in statistics classes lists the waiting times between 272 of its eruptions. The waits run from 43 minutes to 96 minutes, a range of $96 - 43 = 53$ minutes. A dot plot of those waits does not have one pile. It has two clusters: one around 55 minutes and a larger one around 80 minutes, with few waits in between. A single center, somewhere near 70 minutes, would describe hardly any real eruption. The shape told scientists something useful: a short eruption tends to be followed by a short wait, and a long eruption by a long wait. Park rangers use the length of each eruption to predict the next one, instead of announcing one average time for every visitor.
A school nurse surveys 25 students: 'How many hours did you sleep last night?' The dot plot has stacks from 6 to 10 hours, peaking at 8, plus one dot at 80. The nurse writes the description step by step. There are 25 values. The 80 is an outlier, and a student cannot sleep 80 hours in one night, so it is almost certainly a typing mistake for 8. With it the range would be $80 - 6 = 74$ hours, which is nonsense; without it the range is $10 - 6 = 4$ hours. The corrected data is roughly symmetric, centered at 8 hours. That matters, because doctors recommend 9 to 12 hours of sleep a night for children aged 6 to 12, so a center of 8 hours tells the nurse that a typical student is sleeping at least an hour less than recommended.
Counting stacks instead of dots. A dot plot with five stacks may hold thirty values. Every dot is one value.
Naming the skew by the pile. Data that piles up on the left with a tail to the right is skewed right. The tail names it.
Calling the smallest stack an outlier. An outlier is far away on the number line, not just rare. A short stack in the middle of the data is not an outlier.
Describing with the center alone. Two data sets can share a center and look completely different. Always add the spread and the shape.
Asking a question with one answer. 'How many students are in our class?' has one answer, so there is no distribution to describe.
Fifteen students report how many pets they have. Count the dots in the stacks above 0, 1, 2, 3 and 7.
$4 + 5 + 3 + 2 + 1 = 15$
Each dot is one student, and all 15 must be accounted for.
Find the range.
$7 - 0 = 7 \text{ pets}$
The range is the highest value minus the lowest.
Find the peak.
$\text{tallest stack: } 5 \text{ dots above } 1$
The value given most often is where the data piles up.
Find the middle value.
$(15 + 1) \div 2 = 8, \qquad 4 < 8 \le 4 + 5$
The 8th dot from the left is in the stack above 1, so the center is 1 pet.
Describe the shape and name the outlier.
$\text{pile at } 0\text{–}3, \text{ gap at } 4\text{–}6, \text{ outlier at } 7$
The values pile up on the left and thin out to the right, so the data is skewed right, with one student far from the rest.
Ten people at a children's soccer game give their ages. Check that 'How old are the people here?' is a statistical question.
$\text{answers are expected to vary}$
Different people have different ages, so the answers form a distribution.
Put the ages in order.
$9, \; 10, \; 10, \; 11, \; 11, \; 36, \; 38, \; 40, \; 41, \; 44$
Sorting shows at once where the values bunch together.
Find the clusters.
$9\text{–}11 \text{ and } 36\text{–}44$
Five ages are close together near 10, and five are close together near 40: players and parents.
Find the gap between them.
$36 - 11 = 25 \text{ years with no one}$
Nobody at the game is between 12 and 35 years old.
Find the range.
$44 - 9 = 35 \text{ years}$
Highest minus lowest, across both clusters.
Test the middle value as a center.
$\dfrac{11 + 36}{2} = 23.5$
With 10 values the center is halfway between the 5th and 6th. It lands in the gap, an age nobody has, so describe each cluster instead: children about 10, adults about 40.
Twenty students take a 10-point quiz. The number of students with each score, from 4 to 10, is 1, 2, 4, 6, 4, 2, 1. Count the students.
$1 + 2 + 4 + 6 + 4 + 2 + 1 = 20$
Every student is one value.
Find the range.
$10 - 4 = 6 \text{ points}$
The lowest score is 4 and the highest is 10.
Find the peak.
$6 \text{ students scored } 7$
That is the tallest stack.
Compare the two sides of the peak.
$6 \text{ and } 8: 4 = 4, \quad 5 \text{ and } 9: 2 = 2, \quad 4 \text{ and } 10: 1 = 1$
Each score below 7 has the same count as the score the same distance above it, so the plot is symmetric.
Find the middle position.
$20 \text{ values: the 10th and 11th}$
With an even count there are two middle values.
Count to them from the left.
$1 + 2 + 4 = 7 < 10, \qquad 7 + 6 = 13 \ge 11$
Both the 10th and 11th scores are in the stack above 7, so the center is 7 points.
Look for gaps and outliers, then write the description.
$\text{every score from 4 to 10 occurs: no gaps}$
The scores are symmetric about a center of 7, spread over a range of 6 points, with no gaps and no outliers.
Count the values and find the range.
$9 \text{ values}, \qquad 14 - 3 = 11 \text{ hours}$
Highest minus lowest.
Find the middle value.
$(9 + 1) \div 2 = 5 \text{th value} = 5 \text{ hours}$
The values are already in order.
Describe the shape.
Match each word used to describe data with its meaning.
| a question you expect to get many different answers to | a stretch of the number line with no data in it | the highest value minus the lowest value | |
|---|---|---|---|
| statistical question | |||
| gap | |||
| range |
A dot plot shows how many push-ups each student in a gym class did in one minute. It has 2 dots above 23, 8 above 24, 5 above 25 and 2 above 26. Complete the worked solution to find the middle value.
Add the stacks to count the values.
$2 + 8 + 5 + 2 =$ n
Each dot stands for one student, whatever value it sits above.
Find the position of the middle value.
$(\text{total} + 1) \div 2 =$ m
With an odd number of values, the middle one has as many values before it as after it.
Count the dots in the first stack.
$2 \text{ dots above } 23$
That is fewer dots than the middle position, so the middle is further right.
Add the second stack to the count.
$2 + 8 =$ k
Now the count has reached or passed the middle position.
Read the value of that stack.
$\text{middle value} = 24 \text{ push-ups}$
The middle dot is one of the dots above 24.
A dot plot of siblings has five stacks. From left to right they hold 7, 5, 3, 2, 1 dots. Which words describe its shape?
A dot plot of the number of books borrowed this month has 4 dots above 5, 4 above 6, 6 above 7, 2 above 8 and 3 above 9. How many people answered, and how many answered more than 6?
total people answered, and more of them answered more than 6.
A dot plot of the heights of bean plants, in centimeters, has 4 dots above 34, 5 above 35, 5 above 36 and one dot above 49. Which height is the outlier? What is the range with the outlier, and without it?
The outlier is out cm. The range is r1 cm with it and r2 cm without it.
Two classes guessed the number of jelly beans in a jar, in hundreds. Class A's dot plot has 3 dots above 5, 4 above 6 and 3 above 7. Class B's has 4 dots above 2, 3 above 4, 3 above 6, 3 above 8 and 3 above 10. Complete the table for both classes.
| Class A | Class B | |
|---|---|---|
| Number of guesses | ||
| Lowest guess | ||
| Highest guess | ||
| Range |
On six school days a bus was 3, 6, 34, 10, 6 and 4 minutes late. On the day it was 34 minutes late, a road was closed. Which time is the outlier, and what is the range with and without it?
The outlier is out minutes. The range is r1 minutes with it and r2 minutes without it.
An animal shelter weighs its dogs. 6 dogs weigh between 8 and 14 pounds, and 6 dogs weigh between 65 and 80 pounds. No dog weighs anything in between. How many dogs are in each cluster, and how wide is the gap between the clusters?
The small cluster has small dogs, the large cluster has large dogs, and the gap is gap pounds wide.
Lesson test: one question per skill, one attempt each, no hints. Your answers are checked when you submit.
A sixth-grade class was asked, 'How many hours did you sleep last night?' A dot plot of the answers has 2 dots above 6 hours, 3 above 7, 8 above 8, 4 above 9 and 2 above 10. How many students answered, what is the range, and what is the middle answer?
n students answered, the range is r hours, and the middle answer is mid hours.
You can describe a distribution in words and numbers. Without looking: what three things should a description mention, and why is a center alone not enough?
17. Your turn: 9 students do 3, 4, 4, 5, 5, 5, 6, 6 and 14 hours of homework in a week, step 3
$\text{cluster } 3\text{–}6, \text{ gap } 7\text{–}13, \text{ outlier } 14$
Eight values are close together, and 14 sits far away from them.