Back to the on-screen lesson ·
Scaling both parts together, and the straight line through the origin that results.
Paper packet. Every task here also exists on screen, where it is checked automatically; answers written on paper are not assessed by Nydus. When you are back at a device, enter your answers there.
In this lesson you build a table of equivalent ratios by multiplying, dividing or adding rows, find a missing entry, and plot the table on a grid. The points always form a straight line through the origin, and you will see why: that line is what a ratio looks like as a picture, and reading it helps you fill gaps and catch mistakes.
You know that a ratio such as 2 to 3 compares two amounts, and you know your multiplication facts. From grade 5 you can plot a point such as (4, 6) on a grid: go 4 across from the origin, then 6 up. This lesson joins those ideas. A ratio table lists many equal ratios, and a graph shows the same table as a row of points.
| Term | What it means |
|---|---|
| Ratio | A comparison of two amounts, such as 2 cups of rice to 3 cups of water, written 2 to 3 or 2:3. |
| Equivalent ratios | Ratios that describe the same mix, such as 2:3, 4:6 and 10:15. |
| Ratio table | A table whose rows are equivalent ratios, one column for each quantity. |
| Scale factor | The number both parts of a row are multiplied or divided by to make a new row. |
| Ordered pair | Two numbers in brackets, such as (4, 6): across first, then up. |
| Origin | The point (0, 0), where the two axes of a graph meet. |
A ratio table lists equivalent ratios, one in each row. A recipe that uses 2 cups of rice for 3 cups of water gives this table:
| Rice (cups) | Water (cups) |
|---|---|
| 2 | 3 |
| 4 | 6 |
| 6 | 9 |
| 10 | 15 |
Each row is a batch of the same recipe at a different size. You make a new row by doing the same thing to both columns: multiply both by 2, divide both by 2, or add two rows together. The rice and water always change together, which is why the rice tastes the same in every batch.
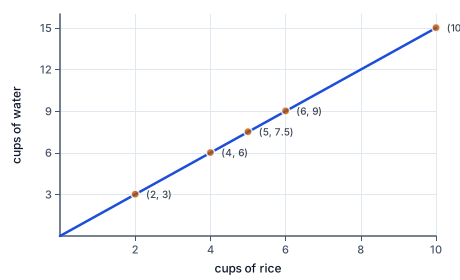
A ratio table can also be drawn as a graph. Each row becomes an ordered pair: the first column goes across and the second column goes up. The rows above become the points (2, 3), (4, 6), (6, 9) and (10, 15). These points always lie on a straight line through the origin, (0, 0). No rice needs no water, so the line starts at zero, and every extra 2 cups of rice adds exactly 3 cups of water, so the line never bends.
Another way: picture
Picture a staircase on graph paper. Start at (0, 0). Each step goes 2 squares right and 3 squares up, and the corner of each step is one row of the table. Lay a ruler on the corners: they are all on one line, and the ruler passes through the bottom corner at (0, 0).
Another way: steps
There are three moves you are allowed to make in a ratio table, and each has a reason.
Multiply both columns by the same number. Tripling the recipe means three times the rice and three times the water: 2:3 becomes 6:9.
Divide both columns by the same number. Halving the recipe 10:15 gives 5:7.5, and dividing by 5 gives 2:3. Dividing is how you reach a small row, which is often the easiest row to build from.
Add two rows. Cooking a batch of 4:6 and a batch of 6:9 in the same pot gives 10:15. Both columns get added, so the mix is unchanged.
One move is not allowed: adding the same number to both columns. Going from 2:3 to 5:6 by adding 3 to each part looks tidy, but 5 cups of rice to 6 cups of water is much drier than 2 to 3. In the first recipe the water is one and a half times the rice; in the second it is only a little more than the rice. Adding changes the ratio; multiplying keeps it.
To graph a ratio table, choose which quantity goes across (the $x$-axis) and which goes up (the $y$-axis), and label both axes with their units. Then plot one point for each row, always in the same order: first column across, second column up.
The points of a ratio table always land on a straight line through (0, 0). That line is useful in three ways.
You can also go the other way, from a graph back to a table. Pick any point on the line where both numbers are easy to read, such as (4, 6).
The chart plots the rice table: every row lands on one line through (0, 0), and (5, 7.5) sits on it between two rows. That point is a row of the table, and every other row is that row multiplied or divided by the same number. Reading two or three points and checking that they give the same ratio is a quick way to be sure the graph really shows a ratio and not some other pattern, such as a line that starts above zero.
Tables also help you compare two mixes. Lemonade A uses 2 scoops of powder for 3 cups of water, and Lemonade B uses 3 scoops for 5 cups. Which is stronger?
Build each table until the water matches:
| Water (cups) | A: scoops | B: scoops |
|---|---|---|
| 15 | 10 | 9 |
Lemonade A reaches 15 cups of water with 5 times its row, $2 \times 5 = 10$ scoops. Lemonade B reaches 15 cups with 3 times its row, $3 \times 3 = 9$ scoops. For the same water, A uses more powder, so A is stronger. On a graph with water across and powder up, A's line is the steeper one.
Most ratio table questions follow the same path.
1. Put the known row in the table. Label the columns with their units so the two quantities cannot be swapped.
2. Look at the column where you know both numbers. If you know 8 cups of ginger ale and want 20, that column tells you how the row must change.
3. Find the scale factor. Divide: $20 \div 8 = 2.5$. If the factor is a whole number, use it. If it is not, first divide the known row down to a smaller row (6:8 becomes 3:4), then find a whole-number factor from there ($20 \div 4 = 5$).
4. Apply the factor to the other column. $3 \times 5 = 15$. Both columns must change by the same factor, because that is what keeps the ratio the same.
5. Check. Use one of these three checks.
If a check fails, look for a row where a number was added instead of multiplied, or where the columns were swapped.
The National Audubon Society recommends filling a hummingbird feeder with 1 part white sugar to 4 parts water, and no red dye. That is a ratio, and a ratio table makes any amount easy.
| Sugar (cups) | Water (cups) |
|---|---|
| 1 | 4 |
| 0.5 | 2 |
| 0.25 | 1 |
| 1.5 | 6 |
A small feeder that holds 2 cups needs the row with 2 cups of water: divide the first row by 2 to get half a cup of sugar. A bigger batch for a week of refills might use 6 cups of water; $6 \div 4 = 1.5$, so 1.5 cups of sugar. If someone instead added 1 cup to both parts of the first row, they would get 2 cups of sugar for 5 cups of water, a mix far sweeter than the recommended one. Plotted with water across and sugar up, all four rows of the table sit on one straight line through (0, 0), and the wrong mix sits well above it.
A pancake recipe uses 2 cups of flour and 3 eggs and makes 12 pancakes. A class of 30 wants 2 pancakes each, which is 60 pancakes.
Put pancakes in the first column. From 12 to 60 is a factor of $60 \div 12 = 5$, so every ingredient is multiplied by 5: $2 \times 5 = 10$ cups of flour and $3 \times 5 = 15$ eggs. A carton holds 12 eggs, so the class needs 2 cartons.
If only 40 pancakes are needed, the factor $40 \div 12$ is not a whole number. Go through a smaller row instead. Dividing the recipe by 3 gives the row for 4 pancakes: $\frac{2}{3}$ cup of flour and 1 egg. From 4 pancakes to 40 is a factor of 10, so 40 pancakes need $\frac{2}{3} \times 10 = 6\frac{2}{3}$ cups of flour and 10 eggs. Choosing a helpful smaller row is part of the skill.
Adding instead of multiplying. Going from 2:3 to 8 cans of the first part, some learners add 6 to both parts and get 8:9. But 8:9 is almost equal amounts, while 2:3 has half as much again of the second part. Multiply both parts by 4 to get 8:12.
Swapping the columns when plotting. The point for 4 cups of rice and 6 cups of water is (4, 6), not (6, 4). Write the axis labels first and keep the same order for every point.
Joining the points to the wrong place. The line of a ratio table goes through (0, 0). A line that crosses the $y$-axis above zero would say that zero rice needs some water, which a ratio cannot say.
Changing only one column. Every move in a ratio table changes both columns. A row where only one number changed is a different recipe.
A recipe uses 2 cups of rice for 3 cups of water. Fill in the rows for 4, 6 and 10 cups of rice. Start with the row you know.
$2 \text{ rice} : 3 \text{ water}$
Every other row will be built from this one.
Multiply both parts by 2 for 4 cups of rice.
$2 \times 2 = 4, \qquad 3 \times 2 = 6$
Twice the rice needs twice the water.
Multiply both parts by 3 for 6 cups of rice.
$2 \times 3 = 6, \qquad 3 \times 3 = 9$
The scale factor is $6 \div 2 = 3$, and it goes on both columns.
Add the rows for 4 and 6 cups to get 10 cups.
$4 + 6 = 10, \qquad 6 + 9 = 15$
Two batches cooked together make one bigger batch with the same mix.
Check every row by dividing water by rice.
$3 \div 2 = 6 \div 4 = 9 \div 6 = 15 \div 10 = 1.5$
The same answer in every row shows they are all equivalent ratios.
A punch uses 6 cups of orange juice for 8 cups of ginger ale. How much juice goes with 20 cups of ginger ale? Find the factor from the ginger ale column.
$20 \div 8 = 2.5$
The factor is not a whole number, so a smaller row will make the work easier.
Divide both parts of the known row by 2.
$6 \div 2 = 3, \qquad 8 \div 2 = 4$
2 goes into both 6 and 8, and dividing both parts keeps the ratio.
Find the factor from the smaller row.
$20 \div 4 = 5$
Now the ginger ale column goes from 4 to 20, a whole-number step.
Multiply the juice by the same factor.
$3 \times 5 = 15$
Both columns of a row are always scaled together.
Write the new row in the table.
$15 \text{ juice} : 20 \text{ ginger ale}$
The answer is 15 cups of orange juice.
Check by simplifying both rows.
$\dfrac{15}{20} = \dfrac{3}{4} = \dfrac{6}{8}$
The new row and the given row reduce to the same fraction, so the punch tastes the same.
A hose fills 3 gallons every 2 minutes. Make a table for 2, 4, 6 and 8 minutes.
$(2, 3), \quad (4, 6), \quad (6, 9), \quad (8, 12)$
Each row is the first row times 1, 2, 3 or 4.
Choose the axes: minutes across, gallons up.
$x = \text{minutes}, \qquad y = \text{gallons}$
The first column of each ordered pair goes across, so the order must match the table.
Plot the four points.
$(2, 3), (4, 6), (6, 9), (8, 12) \text{ on the grid}$
Go across first, then up, for each point.
Draw the line through the points and extend it back.
$\text{the line passes through } (0, 0)$
Zero minutes fill zero gallons, so the origin belongs to the pattern.
Find how far the line climbs for one minute across.
$3 \div 2 = 1.5 \text{ gallons per minute}$
Every 2 minutes add 3 gallons, so each single minute adds half of that.
Read the point for 5 minutes, which is not in the table.
$5 \times 1.5 = 7.5 \quad\Rightarrow\quad (5, 7.5)$
The line is straight, so the point halfway between 4 and 6 minutes is halfway between 6 and 9 gallons.
Check the new point with the ratio.
$\dfrac{7.5}{5} = 1.5 = \dfrac{3}{2}$
Its gallons divided by minutes match every other row, so it is on the same line.
Find the factor from the blue column.
$8 \div 2 = 4$
Blue is the column where both numbers are known.
Multiply the white by the same factor.
Check by simplifying the new row.
A pack holds 3 pencils. Match each row of the ratio table to the point it plots, with packs across and pencils up.
| (1, 3) | (8, 24) | (5, 15) | |
|---|---|---|---|
| 1 packs | |||
| 8 packs | |||
| 5 packs |
A paint mix uses 20 cans of blue for 35 cans of white. Complete the worked solution to fill the table for 1, 2 and 3 times the smallest batch.
Divide both parts of the given row by 5 to reach the smallest whole-number row.
$20 \div 5 =$ a blue, $\quad 35 \div 5 =$ b white
Dividing both columns by the same number keeps the color the same.
Double the smallest row.
$(\text{blue}) \times 2 =$ c, $\quad (\text{white}) \times 2 =$ d
Two batches need twice as much of each color.
Add the smallest row to the doubled row.
$(\text{one batch}) + (\text{two batches}) =$ e blue
One batch and two batches together make three batches.
Check the three-batch row against the smallest row.
$(\text{three-batch blue}) \div 3 = (\text{one-batch blue})$
Dividing by 3 must bring the row back to one batch, or a step went wrong.
A pack holds 4 seed packets. Complete the ratio table for 2, 3 and 5 packs.
2 packs hold a, 3 packs hold b, and 5 packs hold c seed packets.
A ratio table shows 2 cups of juice for 5 cups of punch. How many cups of juice go with 10 cups of punch?
The table entry is answer cups of juice.
A smoothie uses 3 cups of strawberries for every 2 cups of yogurt. Plot the points for 1, 2, 3 and 4 batches, with cups of strawberries across and cups of yogurt up.
Plot your answer on the grid:
A punch recipe's ratio table has the row 8 cups of orange juice to 12 cups of ginger ale. How many cups of orange juice go with 21 cups of ginger ale?
The smaller row is sj cups of juice to sg cups of ginger ale, so answer cups of orange juice go with 21 cups of ginger ale.
The ratio table for 3 pencils per pack is plotted with packs across and pencils up. What do the points form?
Lesson test: one question per skill, one attempt each, no hints. Your answers are checked when you submit.
A punch recipe's ratio table has the row 6 cups of orange juice to 16 cups of ginger ale. How many cups of orange juice go with 56 cups of ginger ale?
The smaller row is sj cups of juice to sg cups of ginger ale, so answer cups of orange juice go with 56 cups of ginger ale.
You can build a ratio table, find a missing entry, and plot the rows. Without looking: what shape does the graph of equivalent ratios always have, and why does it go through the origin?
15. Your turn: a paint mix uses 2 cans of blue for 5 cans of white. How much white goes with 8 cans of blue?, step 2
$5 \times 4 = 20 \text{ cans of white}$
Both colors are scaled together, so the shade stays the same.
15. Your turn: a paint mix uses 2 cans of blue for 5 cans of white. How much white goes with 8 cans of blue?, step 3
$\dfrac{8}{20} = \dfrac{2}{5}$
The new row reduces to the one you started with.