Back to the on-screen lesson ·
Recognize and write statistical questions, whose answers vary, and measure that variability in collected data.
Paper packet. Every task here also exists on screen, where it is checked automatically; answers written on paper are not assessed by Nydus. When you are back at a device, enter your answers there.
In this lesson you learn what makes a question statistical: it expects answers that vary. You sort questions into statistical and not statistical, widen a question about one case into a question about a group, tell numerical data from categorical data, tally collected answers, and use the range to measure how much the answers vary.
In earlier grades you collected data by counting and measuring, and you drew picture graphs, bar graphs and line plots. You can put numbers in order and find the difference between the greatest and the least. Earlier in this course you described distributions by their center, spread and shape, computed the mean, median and range, and read dot plots, histograms and box plots. This lesson goes back to where every one of those starts: the question. Before any data is collected, someone has to ask a question that data can answer, and not every question can be answered that way.
| Term | What it means |
|---|---|
| Statistical question | A question that expects answers that vary, so it is answered by collecting data: 'How many hours do sixth graders sleep?' |
| Variability | The way answers differ from one person or case to the next. |
| Data | The answers collected for a statistical question, one for each person or case. |
| Numerical data | Answers that are numbers you can order and compute with, such as minutes or inches. |
| Categorical data | Answers that are names or groups, such as favorite color or type of pet. |
| Range | The greatest answer minus the least answer: a quick measure of how much the answers vary. |
| Tally | A mark made for each answer as it is counted, grouped in fives. |
Some questions have one answer. 'How many days are in a week?' is 7, whoever you ask. 'How far is it from our school to the library?' has one answer too, even if you have to measure it. Other questions have many answers, because the thing they ask about changes from person to person or case to case. 'How many hours of sleep did the students in our class get last night?' has a different answer for almost every student.
A question like the second kind is a statistical question. It expects variability: answers that are not all the same. To answer it you must collect data, one answer from each person or case, and then describe the whole collection. 'Most students slept between 8 and 9 hours, and the answers ranged from 6 to 11' is an answer to a statistical question. It describes a group, not one person.
Here is the test. Imagine asking the question over and over, of different people or about different cases. If you would get the same answer every time, the question is not statistical. If you would get many different answers, it is. Whether the answer is a number, and how hard it is to find, do not matter.
Another way: story
A coach asks, 'How fast can Jada run a mile?' That has one answer, Jada's time. Then the coach asks, 'How fast can the runners on our team run a mile?' Now there are twenty answers, one per runner, and the coach can describe the fastest, the slowest and the typical time. Changing 'Jada' to 'the runners on our team' turned the question into a statistical one.
Another way: numbers
Ask five students their age in years and you might hear 11, 12, 11, 12, 11: the answers vary a little. Ask the same five students how many days are in a week and you hear 7, 7, 7, 7, 7: no variability at all. Only the first question needed data.
Most questions fall into one of three groups.
| Kind of question | Example | Statistical? |
|---|---|---|
| A fact with one answer | How many states are in the United States? | no |
| About one person or thing | How tall is my brother? | no |
| About a group that varies | How tall are the players on the team? | yes |
The first two kinds have one answer, even if you have to look it up or measure it. The third kind asks about a whole group whose members differ, so its answer is a description of many values.
Be careful with questions about one thing measured many times. 'How many minutes does my bus take to get to school each day this month?' is about one bus, but the time changes from day to day with traffic and weather, so the answers vary. It is a statistical question too. The test is always the same: would repeated answers differ?
A question about one case can almost always be widened into a statistical one. Three changes do it.
'How long is my pencil?' becomes 'How long, in centimeters, are the pencils in our classroom?' 'How many pets do I have?' becomes 'How many pets do the families on our street have?' A good statistical question is clear enough that two people collecting the data would record the same answer for the same case. 'Do students like school?' is vague; 'On a scale of 1 to 5, how much do sixth graders at our school enjoy science class?' can actually be answered.
The answers to a statistical question are of two kinds. Numerical data are numbers you can order and do arithmetic with: heights, times, counts, temperatures. Categorical data are names of groups: favorite sport, eye color, the state someone was born in.
Both kinds can vary, so both kinds of question can be statistical. 'What is the favorite fruit of students in our class?' is statistical, and its answers are categories. But the tools you use differ. For numerical data you can find a range, a mean, a median, and draw a dot plot or histogram. For categorical data you count how many gave each answer and draw a bar graph; there is no range of favorite fruits. Sixth-grade statistics focuses on numerical data, because that is where center and spread make sense.
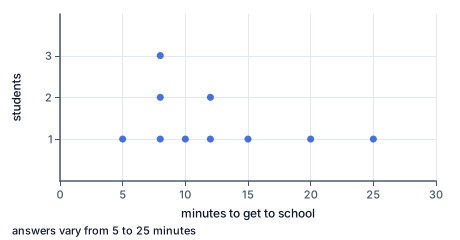
The dot plot shows the answers of ten students to 'How many minutes does it take you to get to school?' Each dot is one student. Look first at how wide the dots spread: from 5 minutes on the left to 25 on the right, a range of $25 - 5 = 20$ minutes. That spread is the variability the question expected. Next look for where the dots pile up: three students answered 8 minutes and two answered 12, so most students take between 8 and 12 minutes. Then notice that no two answers far apart come from the same student: every dot is a different person with a different trip. If the question had been 'What time does school start?', all ten dots would sit in one tall stack above a single value, and there would be nothing to describe.
To decide whether a question is statistical:
To make and use a statistical question:
To check:
The Constitution requires the United States to count its people every ten years, and a census has been taken every ten years since 1790; the most recent one was in 2020. The census form asks questions such as 'How many people were living or staying in this house on April 1?' For one household that has one answer, but across the country it is a statistical question: some homes hold one person, others eight. Collecting every answer lets the Census Bureau describe the whole distribution. Suppose ten homes on one street answer 1, 2, 2, 3, 4, 2, 5, 1, 3 and 7. The answers range from 1 to 7, a range of 6, and the most common answer is 2. Across the nation the average household in 2020 had about 2.5 people. Those results decide how many seats each state gets in the House of Representatives, so asking a clear statistical question matters.
A city engineer wants to know whether a street near a school needs a new crosswalk. 'How busy is Oak Street?' is too vague to answer. The engineer turns it into a statistical question: 'How many cars pass the corner of Oak and Fifth between 7:30 and 8:00 a.m. on school days?' Counting for ten school days gives 84, 97, 102, 88, 131, 95, 90, 99, 105 and 93 cars. The answers vary from 84 to 131, a range of 47, and all but one day had between 84 and 105 cars. The one busy day, 131 cars, turned out to be the day of a school event. Because the question named a place, a time and a unit, two engineers counting on the same day would record the same number, and the city can compare the counts with its rules for when a crosswalk is needed.
Thinking any question with a number answer is statistical. 'How many inches are in a yard?' has a number answer, 36, but only one.
Thinking a hard question is statistical. 'How far is the Moon from Earth?' is hard to measure, but it is not about variability across a group.
Forgetting that one thing can vary over time. 'How many minutes late is my bus each day?' is about one bus but many days, so it is statistical.
Writing a vague question. 'Are students tall?' cannot be answered with data until you say which students and measure height in a unit.
Confusing the range with the greatest value. The range is greatest minus least, not the greatest answer.
Is 'How many inches of rain fell in our town each day last April?' statistical?
$30 \text{ days, amounts differ} \;\Rightarrow\; \text{statistical}$
One town, but many days, and rainfall changes from day to day.
Is 'How many inches are in a foot?' statistical?
$\text{always } 12 \;\Rightarrow\; \text{not statistical}$
A fixed fact has one answer whoever is asked.
Is 'What sports do the students in our grade play?' statistical?
$\text{answers differ by student} \;\Rightarrow\; \text{statistical}$
The answers are categories, but they still vary across the group.
Is 'How old is our principal?' statistical?
$\text{one person, one age} \;\Rightarrow\; \text{not statistical}$
A question about a single case has a single answer.
Is 'How long are the snakes at the city zoo?' statistical?
$\text{many snakes, lengths differ} \;\Rightarrow\; \text{statistical}$
Each snake is a case, and the cases are not all the same length.
Start with 'How long did it take me to get to school today?' Decide whether it is statistical.
$\text{one person, one day} \;\Rightarrow\; \text{one answer}$
Asking it again gives the same answer, so it is not statistical.
Choose a group to ask.
$\text{group} = \text{the students in our class}$
A group whose members differ can give different answers.
Choose what to measure and its unit.
$\text{time to get to school, in minutes}$
A clear unit means everyone records the same kind of number.
Write the new question.
$\text{How many minutes does it take the students in our class to get to school?}$
It names the group, the measurement and the unit.
Predict whether the answers will vary.
$\text{walkers, bus riders, car riders} \;\Rightarrow\; \text{different times}$
Students live at different distances and travel in different ways.
Say what kind of data it will produce.
$\text{numerical data, one number per student}$
Minutes are numbers, so the answers can be ordered and their range found.
Ten students answered the new question with 5, 12, 8, 15, 8, 20, 10, 8, 25 and 12 minutes. Count the answers.
$10 \text{ answers}$
There should be one answer for each student asked.
Put the answers in order.
$5, 8, 8, 8, 10, 12, 12, 15, 20, 25$
Ordering makes the ends and the repeats easy to see.
Find the least answer.
$\text{least} = 5$
It is the first value in the ordered list.
Find the greatest answer.
$\text{greatest} = 25$
It is the last value in the ordered list.
Find the range.
$25 - 5 = 20 \text{ minutes}$
The range measures how far the answers spread.
Find the answer given most often.
$8 \text{ minutes, given by } 3 \text{ students}$
A repeated value shows where answers pile up.
Decide what the data shows about the question.
$\text{range} = 20 > 0 \;\Rightarrow\; \text{the answers vary}$
The variability confirms that the question was statistical.
Find who the question is about.
$\text{a group: sixth graders}$
The question is about many people.
Predict the answers.
$\text{different students, different hours}$
Weekends differ from family to family.
Decide whether it is statistical.
Which of these is a statistical question?
Five students answer 'How many minutes did you read last night?' Their answers are 27, 19, 23, 34 and 23. Complete the worked solution to measure how much the answers vary.
Put the answers in order from least to greatest.
$19, \; 23, \; 23, \; 27, \; 34$
Ordered data shows at once where the answers start and stop.
Subtract the least answer from the greatest.
$\text{greatest} - \text{least} =$ r minutes
The range is one number that measures how far the answers spread.
Count the different values in the list.
$\text{different values} =$ k
Two students gave the same answer, so that value is counted once.
Decide whether the question was statistical.
$\text{range} > 0$
The answers were not all the same, so the question anticipated variability.
Sort each question into statistical or not statistical.
| statistical | not statistical | |
|---|---|---|
| How many pets do the families in this town have? | ||
| How many hours did each classmate sleep last night? | ||
| How many days are in a week? | ||
| How many pets do I have? |
Why is 'How old are the teachers in my school?' a statistical question?
Six classmates answer 'How many minutes did you practice your instrument yesterday?' Their answers are 15, 29, 9, 13, 21 and 15. Find the least answer, the greatest answer and the range.
The least answer is lo minutes, the greatest is hi minutes, and the range is r minutes.
Twelve students answer 'How many brothers and sisters do you have?' Their answers, in the order they came, are 3, 2, 2, 1, 0, 2, 3, 1, 2, 2, 1, 3. Complete the table with how many students gave each answer.
| Number of students | |
|---|---|
| 0 siblings | |
| 1 sibling | |
| 2 siblings | |
| 3 siblings |
At an animal shelter, a volunteer checks four dogs. For the question 'How many legs does each dog have?' the answers are 4, 4, 4 and 4. For 'How many pounds does each dog weigh?' the answers are 32, 19, 51 and 24. Find the range of each set of answers.
The range of the leg answers is legs, and the range of the weights is wt pounds.
Lesson test: one question per skill, one attempt each, no hints. Your answers are checked when you submit.
A school librarian asks sixth graders, 'How many books did you read last month?' 6 students say 1 book, 9 say 2 books, 7 say 3 books and 1 say 6 books. How many students answered, and what is the range of the answers?
n students answered, and the range of the answers is r books.
You can recognize and write statistical questions. Without looking: why is 'How old am I?' not statistical, and how would you change it into a question that is?
16. Your turn: is 'How many hours of screen time do sixth graders have on a Saturday?' statistical?, step 3
$\text{answers vary} \;\Rightarrow\; \text{statistical}$
Expected variability is the test.