Back to the on-screen lesson ·
Whether the gap between two centers is large compared with the spread.
Paper packet. Every task here also exists on screen, where it is checked automatically; answers written on paper are not assessed by Nydus. When you are back at a device, enter your answers there.
In this lesson you compare two groups by asking whether the gap between their centers is large next to how spread out they are. A five-centimeter difference in height means a lot between two groups that vary by two centimeters, and very little between two that vary by twenty. You will measure the gap in MADs or IQRs and decide how much the groups overlap.
In grade 6 you learned two ways to find the center of a data set, the mean and the median, and two ways to measure its spread, the mean absolute deviation (MAD) and the interquartile range (IQR). You can find each one from a list of numbers. In this lesson you use them together to compare two groups, and to decide whether a difference between the groups is big or small.
| Term | What it means |
|---|---|
| Population | The whole group you want to know about, such as every 7th grader in a state. |
| Sample | The part of the population you actually measure. |
| Mean | The total of the values divided by how many values there are. |
| Median | The middle value when the values are listed in order. |
| Mean absolute deviation (MAD) | The average distance of the values from their mean. A small MAD means the values are bunched together. |
| Interquartile range (IQR) | The distance between the first quartile and the third quartile: the spread of the middle half of the data. |
| Outlier | A value far away from the rest of the data. |
| Overlap | How much of the range of one group is shared with the other group. |
Suppose one class has a mean test score of 78 and another has a mean of 83. The gap between the centers is 5 points. Is that a big difference?
It depends on the spread. If the scores in each class are bunched tightly, with a MAD of 2 points, the gap is $5 \div 2 = 2.5$ MADs. Almost every student in the second class scored higher than almost every student in the first. The difference is clear.
If the scores in each class are scattered, with a MAD of 10 points, the gap is only $5 \div 10 = 0.5$ MADs. The two classes overlap almost completely. Many students in the first class beat many in the second. The difference is small.
So the rule is: divide the gap between the centers by a measure of spread. Use the MAD with the mean, or the IQR with the median. A result of about 2 or more means the groups barely overlap. A result well below 1 means they overlap a lot.
Another way: picture
Draw two dot plots on the same number line, one above the other. When the groups are far apart and each is narrow, you see two separate clumps of dots. When they are close together or each is wide, the dots of the two groups sit over the same numbers.
Another way: steps
The same gap can mean very different things. The table shows three pairs of groups. Each pair has means 5 apart, but the spread changes.
| Mean of group A | Mean of group B | MAD of each | Gap in MADs | What a dot plot shows |
|---|---|---|---|---|
| 40 | 45 | 1 | 5 | Two separate clumps |
| 40 | 45 | 2.5 | 2 | Slight overlap |
| 40 | 45 | 10 | 0.5 | Almost total overlap |
In the first row, knowing which group a value came from almost tells you whether it is near 40 or near 45. In the last row, a value of 43 could easily be from either group.
This is why scientists never report only a difference. They report the spread too, so a reader can judge whether the difference stands out from the natural variation.
A picture often answers the question before any arithmetic. Draw one number line and put a dot plot for each group on it, one above the other, using the same scale.
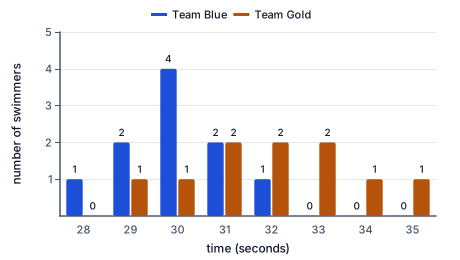
Suppose a coach times 10 swimmers from each of two teams in the 50-yard freestyle, to the nearest second.
Each bar counts the swimmers who finished in that many seconds, so a bar of height 4 is a column of 4 dots on a dot plot. Team Blue's times sit between 28 and 32 seconds, bunched around 30: its mean is 30 seconds and its MAD is 0.8 second. Team Gold's times sit between 29 and 35 seconds, spread around 32: its mean is 32 seconds and its MAD is 1.4 seconds. Look where the two colors share the same seconds: from 29 to 32 there are swimmers from both teams. The centers are 2 seconds apart. Measured with the larger MAD, the gap is $2 \div 1.4$, about 1.4 MADs. The picture and the number agree: Team Blue tends to be faster, but some Gold swimmers beat some Blue swimmers.
Use the picture as a check on the calculation. Two clumps with clear space between them should give 2 or more; clumps drawn on top of each other should give less than 1.
Always pair a center with its matching spread: the mean with the MAD, and the median with the IQR.
Use the mean and MAD when the data is roughly balanced, with no values far from the rest. Heights of students or weights of apples from one tree are usually like this.
Use the median and IQR when the data has outliers or is lopsided. Think of the prices of five houses: 200, 210, 220, 230 and 1,000 thousand dollars. The mean is $1{,}860 \div 5 = 372$ thousand, higher than four of the five prices. The median is 220 thousand, a much better picture of a typical house. The outlier pulled the mean, but it did not move the median.
When you compare two groups, use the same pair of measures for both, or the comparison is not fair.
Usually you cannot measure a whole population. A researcher who wants to compare the sleep of 7th graders and 11th graders across a state cannot ask every student. Instead she takes a random sample from each group, maybe 50 students each, and compares the samples.
Two random samples from the same population will not match exactly. If you sampled 50 students twice, the two sample means might differ by a few minutes just by chance. So a small gap between two samples could be only chance. A gap of 2 MADs or more is hard to explain by chance, and makes it reasonable to say the populations really differ.
Larger samples help. The means of big random samples vary less from one sample to the next, so a smaller real difference can be trusted.
Every comparison in this lesson follows the same steps.
Each step has a reason. Choosing the measures first keeps an outlier from fooling you. Dividing by the spread turns the gap into a number you can judge the same way for any data, whether it is test scores or tree heights.
How to check. A MAD or IQR can never be negative, and it is smaller than the whole range of the data. A mean or median must lie between the smallest and largest value. Sketch the two groups on one number line: if your answer says 3 MADs apart, the sketch should show two separate clumps. If it says 0.4, the clumps should overlap almost completely.
A factory fills cereal boxes labeled 16 ounces on two machines. A quality inspector weighs a random sample of 30 boxes from each machine. Machine 1 has a mean of 16.2 ounces with a MAD of 0.1 ounce. Machine 2 has a mean of 16.0 ounces with a MAD of 0.1 ounce. The gap is $16.2 - 16.0 = 0.2$ ounce, which is $0.2 \div 0.1 = 2$ MADs. The two machines clearly behave differently, so the inspector adjusts machine 1, which is giving away cereal on every box. If the MADs had been 0.4 ounce, the same 0.2 ounce gap would be only half a MAD, and the inspector would have no reason to think the machines differ.
A school district tries a new reading program in some classrooms. At the end of the year, a random sample of 40 students who used it has a mean reading score of 212 with a MAD of 8. A random sample of 40 students who did not use it has a mean of 208 with a MAD of 8. The gap is 4 points, only $4 \div 8 = 0.5$ MAD. The two groups overlap almost completely, and a gap that size could come from which students happened to be sampled. The district decides to try the program for another year and collect more data before spending money on it everywhere.
A consumer magazine tests 25 AA batteries of each of two brands in the same flashlight. A few batteries of each brand are duds that die in minutes, so the testers use medians and IQRs. Brand A has a median life of 9 hours with an IQR of 1 hour. Brand B has a median of 7 hours with an IQR of 1 hour. The gap is 2 hours, which is 2 IQRs. The magazine reports that brand A clearly lasts longer, and adds that brand A costs 1.25 dollars a battery while brand B costs 90 cents. Readers can then compare hours per dollar: $9 \div 1.25 = 7.2$ hours for brand A and $7 \div 0.90 \approx 7.8$ hours for brand B.
The most common mistake is judging a gap without the spread. A gap of 5 is huge between groups with a MAD of 1, and tiny between groups with a MAD of 20. Always divide by the spread before you decide.
The second is mixing measures: comparing the mean of one group with the median of the other, or dividing a gap between medians by a MAD. Keep the pairs together.
The third is forgetting to ignore the sign when finding a MAD. The distances from the mean are all positive. If you keep the signs, they always add to zero, and the MAD would always be 0.
The last is claiming too much from a small sample. If two samples of five people differ by half a MAD, that may be chance. It does not prove the populations differ.
Five quiz scores are 3, 5, 8, 10 and 14. Add them.
$3 + 5 + 8 + 10 + 14 = 40$
The mean starts with the total.
Divide the total by 5 to find the mean.
$40 \div 5 = 8$
There are five scores.
Find each score's distance from 8.
$5, \; 3, \; 0, \; 2, \; 6$
A distance ignores whether the score is above or below the mean.
Add the distances.
$5 + 3 + 0 + 2 + 6 = 16$
The MAD is an average distance, so it starts with a total too.
Divide by 5 to find the MAD.
$16 \div 5 = 3.2$
A typical score is about 3.2 points from the mean of 8.
Plants given plant food have a mean height of 24 cm with a MAD of 3 cm. Plants without it have a mean of 18 cm with a MAD of 3 cm. Find the gap.
$24 - 18 = 6$
The gap is the distance between the two centers.
Check that the spreads are about the same.
$\text{MAD} = 3 \text{ and } 3$
With equal spreads, one MAD can serve as the ruler for both groups.
Divide the gap by the MAD.
$6 \div 3 = 2$
This counts how many MADs fit between the centers.
Picture where most plants lie, one MAD either side of each mean.
$\text{food: } 21 \text{ to } 27, \qquad \text{no food: } 15 \text{ to } 21$
Most values sit within about one MAD of their mean.
Read the overlap.
$\text{the ranges only touch at } 21$
Two MADs apart means the typical plants of the two groups barely overlap.
Draw the conclusion.
$2 \text{ MADs} \Rightarrow \text{a clear difference}$
If the plants were assigned at random, the plant food is the likely reason.
Seven workers in town A commute 12, 15, 18, 20, 22, 25 and 60 minutes. Seven in town B commute 25, 28, 30, 32, 35, 38 and 40 minutes. Choose the measures.
$60 \text{ is an outlier} \Rightarrow \text{median and IQR}$
One very long commute would pull town A's mean up.
Find town A's median, the middle of seven values.
$12, 15, 18, \mathbf{20}, 22, 25, 60 \Rightarrow 20$
The fourth value has three values on each side.
Find town A's quartiles, the middles of each half.
$Q_1 = 15, \quad Q_3 = 25$
The lower half is 12, 15, 18 and the upper half is 22, 25, 60.
Subtract to find town A's IQR.
$25 - 15 = 10$
The IQR is the spread of the middle half, and the 60 does not affect it.
Find town B's median.
$25, 28, 30, \mathbf{32}, 35, 38, 40 \Rightarrow 32$
Again the fourth of seven values is the middle.
Find town B's IQR from its quartiles.
$38 - 28 = 10$
The lower half is 25, 28, 30 and the upper half is 35, 38, 40.
Find the gap between the medians.
$32 - 20 = 12$
The medians are the two centers.
Divide the gap by the IQR.
$12 \div 10 = 1.2$
Both IQRs are 10, so 10 is the ruler.
Draw the conclusion.
$1.2 \text{ IQRs} \Rightarrow \text{some overlap}$
Town B's commutes tend to be longer, but many workers in the two towns commute about the same time.
Find the gap between the means.
$52 - 40 = 12$
Subtract the smaller center from the larger.
Divide the gap by the MAD.
Draw the conclusion.
Two groups have means of $66$ and $78$, and each group has a mean absolute deviation (MAD) of $8$. Is the difference between the groups a clear one?
Group A scored $25$, $31$, $37$ and $43$. Group B scored $37$, $43$, $49$ and $55$. Each group has a MAD of $6$. Complete the worked solution for how many MADs apart the means are.
Add group A's scores and divide by 4.
$136 \div 4 =$ ma
The mean shares the total equally among the four scores.
Add group B's scores and divide by 4.
$184 \div 4 =$ mb
Each group gets its own mean.
Subtract the smaller mean from the larger one.
$\text{gap} =$ g
The gap is the distance between the two centers.
Divide the gap by the MAD.
$\text{gap} \div \text{MAD} =$ k
This measures the gap with the spread as the ruler.
You want to describe the scores on a quiz where nearly everyone scored between 6 and 10. Which pair of measures should you use?
Class A has a mean test score of $44$ and class B has a mean of $64$. Both classes have a MAD of $5$. How many MADs apart are the two means?
answer MADs
Four scores are $15$, $19$, $27$ and $31$. Their mean is $23$. What is the mean absolute deviation?
MAD $=$ answer
A class grows bean seedlings. Five seedlings in sunlight reach heights of $19$, $20$, $21$, $22$ and $23$ cm. Five in shade reach $17$, $18$, $19$, $20$ and $21$ cm. What is the mean of each sample, and how many centimeters apart are the two means?
Sunlight mean: s cm. Shade mean: h cm. Gap: g cm.
A tester runs 40 batteries of each of two brands in the same toy. Brand X has a median life of $25$ hours and brand Y a median of $28$ hours. Both brands have an interquartile range (IQR) of $3$ hours, and a few batteries of each lasted far longer than the rest. How many IQRs apart are the two medians?
Answer:
Lesson test: one question per skill, one attempt each, no hints. Your answers are checked when you submit.
The daily high temperatures in a town for six days were $73$, $77$, $74$, $79$, $75$ and $78$ degrees Fahrenheit. Find their mean, the total of the six distances from the mean, and the mean absolute deviation, in degrees.
Mean: m°F. Total distance: d°F. MAD: a°F.
You can compare two populations from their centers and spreads. Without looking: why is a gap of 5 between two means not enough on its own to say the groups differ, and when would you use the median and IQR instead of the mean and MAD?
17. Your turn: means of 52 and 40, each with a MAD of 4, step 2
$12 \div 4 = 3$
This counts the MADs between the centers.
17. Your turn: means of 52 and 40, each with a MAD of 4, step 3
$3 \text{ MADs} \Rightarrow \text{a clear difference}$
Three MADs is more than two, so the groups barely overlap.