Back to the on-screen lesson ·
The test that decides: is the rate of change constant?
Paper packet. Every task here also exists on screen, where it is checked automatically; answers written on paper are not assessed by Nydus. When you are back at a device, enter your answers there.
In this lesson you tell a linear function from a nonlinear one. There is a single test: is the rate of change the same everywhere? It works on a table, a graph or an equation. A graph that curves, a table whose differences grow, an equation with an $x^{2}$ in it: all three are the same fact seen from different angles.
You know that a linear function can be written $y = mx + b$, that $m$ is its rate of change (the slope) and $b$ its initial value, and that its graph is a straight line. You can find a rate of change from two points: change in $y$ divided by change in $x$. You can read a table, plot points, and square a number. This lesson asks a new question: given a function, how can you tell whether it is linear at all? Many functions in the real world are not.
| Term | What it means |
|---|---|
| Linear function | A function whose rate of change is the same everywhere. Its graph is a straight line and its equation can be written $y = mx + b$. |
| Nonlinear function | A function whose rate of change is not constant. Its graph is not a straight line. |
| Difference (first difference) | In a table, one $y$-value subtracted from the next: how much $y$ jumps between neighboring rows. |
| Constant rate | The same change in $y$ for every change of $1$ in $x$, wherever you look. |
| Quadratic function | A function with an $x^{2}$ term, such as $y = x^{2}$ or $y = 16t^{2}$. Its graph is a U-shaped curve called a parabola. |
A function is linear when its rate of change is the same everywhere. Every step of $1$ in $x$ changes $y$ by the same amount, wherever you start. If the rate changes anywhere, the function is nonlinear.
That one fact shows up in three places:
These are not three different rules. A constant rate is exactly what makes the graph straight, because a line has the same steepness all along it, and exactly what the form $mx + b$ says: the $m$ is the one rate that never changes.
Another way: picture
Imagine walking up the graph from left to right. On a line the slope under your feet never changes. On a curve you are climbing more and more steeply, or leveling off, or turning around. Any change in steepness means nonlinear.
Another way: story
Filling a bathtub from a tap at a steady flow adds the same amount every minute: linear. The area of a square as its side grows is different: going from side $1$ to $2$ adds $3$ square units, but going from $10$ to $11$ adds $21$. The bigger the square, the more one extra unit of side adds.
To test a table, first look at the $x$-values. If they go up in equal steps, subtract each $y$ from the next. Equal differences mean linear; unequal differences mean nonlinear. For example:
| $x$ | $0$ | $1$ | $2$ | $3$ |
|---|---|---|---|---|
| $y$ | $20$ | $17$ | $14$ | $11$ |
The differences are $-3, -3, -3$, so this is linear with rate $-3$. Going down is fine; what matters is that every step is the same.
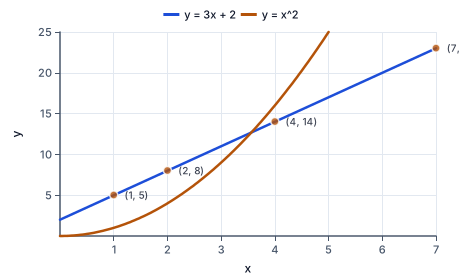
Now look at a table whose $x$-values are not evenly spaced: $x = 1, 2, 4, 7$ and $y = 5, 8, 14, 23$. The jumps in $y$ are $3, 6, 9$, which are not equal. But the jumps in $x$ are $1, 2, 3$. Divide each jump in $y$ by its jump in $x$: $3 \div 1 = 3$, $6 \div 2 = 3$, $9 \div 3 = 3$. The rate is always $3$, so this function is linear: $y = 3x + 2$.
So the safe test is the rate, not the raw difference. When the steps in $x$ are equal, the differences and the rates tell the same story. When they are not, you must divide.
Plot the points and hold a ruler against them. If one straight line passes through every point, the function is linear. If the points bend away from any line you try, it is nonlinear.
Be careful with only a few points, or points close together. The points $(0, 0)$, $(1, 1)$ and $(2, 4)$ from $y = x^{2}$ already show a bend, but plotting only $(0, 0)$ and $(1, 1)$ would look like a line, because any two points lie on a line. You need at least three points to test, and more is better.
Nonlinear graphs come in many shapes. The graph of $y = x^{2}$ is a U-shape. The graph of $y = \frac{12}{x}$ is a curve that drops quickly and then levels off. The graph of $y = 2^{x}$ starts flat and then shoots upward. What they have in common is that their steepness changes as you move along them.
A graph can also fool you if its scale is squeezed. A curve drawn over a tiny stretch of $x$, or with a $y$-axis that runs to a huge number, can look almost straight. When a graph comes with a grid, read off three or four points and work out the rates between them, just as you would for a table. The numbers settle the question when your eyes cannot.
The chart puts the uneven table, y = 3x + 2, beside y = x squared: one keeps a steady steepness and the other does not.
An equation gives a linear function when it can be rearranged into $y = mx + b$. So look at how $x$ appears:
Brackets can hide the truth either way. $y = 2(x + 3)$ looks busy but is $2x + 6$, linear. And $y = (x + 1)^{2} - x^{2}$ looks nonlinear, but multiplied out it is $x^{2} + 2x + 1 - x^{2} = 2x + 1$, which is linear. Always simplify before you decide.
Why each move is allowed. "Linear" means constant rate, and the rate between two rows is change in $y$ over change in $x$. Checking every pair of neighboring rows checks the rate across the whole table. Simplifying an equation does not change the function, only how it looks, so the simplified form tells you the truth about the original.
How to check. If you decided linear, write $y = mx + b$ and test it on every row: one row that fails means you were wrong. If you decided nonlinear, point to two rates that differ; that is your evidence. A sketch helps too: a table you called linear should plot as a straight line.
An object dropped near the ground (ignoring air resistance) falls a distance of about $d = 16t^{2}$ feet in $t$ seconds. After $1, 2, 3, 4$ seconds that is $16, 64, 144, 256$ feet. The differences are $48, 80, 112$: each second it falls $32$ feet farther than the second before, because it keeps speeding up. That is nonlinear, and it is why a fall of $4$ seconds is not twice as far as a fall of $2$ seconds, but four times as far.
A skydiver who has reached top speed is different. Air resistance stops the speeding up, and the skydiver drops roughly the same distance every second. From then on the height is a linear function of time, which is how jumpers can plan when to open their parachutes.
Pizzas are sold by their diameter, but you eat the area. A $12$-inch pizza has radius $6$ inches and area $3.14 \times 36 \approx 113$ square inches. A $16$-inch pizza has radius $8$ inches and area $3.14 \times 64 \approx 201$ square inches. The diameter grew by a third, but the area grew by about $78\%$.
Area is a nonlinear function of diameter: each extra inch of diameter adds more pizza than the inch before. If a $12$-inch pizza costs $\$12$ and a $16$-inch one costs $\$16$, the price per inch is the same, but the price per square inch is about $10.6$ cents for the small one and $8.0$ cents for the large one. The large one is the better deal.
Put $\$1000$ in an account that pays $5\%$ simple interest a year: you get $\$50$ each year, so after $1, 2, 3$ years you have $\$1050$, $\$1100$, $\$1150$. The differences are all $\$50$: linear.
With $5\%$ compound interest, each year's $5\%$ is taken of the new total. You have $\$1050$, then $\$1102.50$, then about $\$1157.63$. The differences are $\$50$, $\$52.50$, $\$55.13$: growing, so nonlinear. After $30$ years the simple account holds $\$2500$ but the compound one holds about $\$4322$, which is why banks advertise compound interest to savers.
"It always goes up, so it is linear." $y = x^{2}$ goes up for positive $x$ but is not linear. Linear means going up (or down) by the same amount.
Checking the $x$-values instead of the $y$-values. Equal steps in $x$ are where you start, not the test.
Forgetting to divide when the $x$ steps are uneven. Unequal jumps in $y$ can still be a constant rate.
Judging from two points. Any two points lie on a line; test at least three.
Judging an equation before simplifying. $2(x + 3)$ is linear; $x(x + 3)$ is not. Multiply out first.
Is the table $x$: $0, 1, 2, 3, 4$ and $y$: $3, 7, 11, 15, 19$ linear? Check the steps in $x$.
$1, \ 1, \ 1, \ 1$
With equal steps in $x$, the differences in $y$ can be compared directly.
Find the first two differences in $y$.
$7 - 3 = 4, \qquad 11 - 7 = 4$
Subtract each $y$ from the next.
Find the last two differences.
$15 - 11 = 4, \qquad 19 - 15 = 4$
Every pair of neighbors must be checked, not just the first.
Decide whether the table is linear.
$\text{differences } 4, 4, 4, 4 \Rightarrow \text{linear, rate } 4$
The same change for every step in $x$ is a constant rate.
Write the equation and test it.
$y = 4x + 3; \qquad 4 \times 4 + 3 = 19$
The initial value is $y$ at $x = 0$; the last row confirms the equation.
A square has side $s$ and area $A = s^{2}$. Make a table for $s = 1, 2, 3, 4$.
$A: \ 1, \ 4, \ 9, \ 16$
Square each side length.
Find the change from $s = 1$ to $s = 2$.
$4 - 1 = 3$
The steps in $s$ are equal, so compare the changes in $A$.
Find the change from $s = 2$ to $s = 3$.
$9 - 4 = 5$
Already different from the first change.
Find the change from $s = 3$ to $s = 4$.
$16 - 9 = 7$
Each change is $2$ more than the one before.
Decide whether the area is linear.
$3 \ne 5 \ne 7 \Rightarrow \text{nonlinear}$
The rate of change is not constant.
Confirm from the equation.
$A = s^{2} = s \times s$
The input is squared, which an equation for a line never has.
Is the table $x$: $1, 2, 4, 7$ and $y$: $5, 8, 14, 23$ linear? Find the jumps in $x$.
$2 - 1 = 1, \quad 4 - 2 = 2, \quad 7 - 4 = 3$
The $x$-values are not evenly spaced, so the raw differences in $y$ cannot be compared.
Find the jumps in $y$.
$8 - 5 = 3, \quad 14 - 8 = 6, \quad 23 - 14 = 9$
These are unequal, but so are the jumps in $x$.
Divide the first jump in $y$ by its jump in $x$.
$3 \div 1 = 3$
The rate of change is change in $y$ per unit of $x$.
Divide the second pair.
$6 \div 2 = 3$
Same rate.
Divide the third pair.
$9 \div 3 = 3$
Same rate again.
Decide whether the table is linear.
$\text{rate } 3 \text{ everywhere} \Rightarrow \text{linear}$
A constant rate between every pair of rows means linear.
Find the initial value by stepping back from $x = 1$.
$b = 5 - 1 \times 3 = 2$
One unit back in $x$ takes $3$ off $y$.
Write the equation and test it on the last row.
$y = 3x + 2; \qquad 3 \times 7 + 2 = 23$
The equation reproduces the table, so the decision is confirmed.
Check the steps in $x$.
$1, \ 1, \ 1$
Equal steps, so compare differences.
Find the differences in $y$.
$9 - 10 = -1, \quad 6 - 9 = -3, \quad 1 - 6 = -5$
Later $y$ minus earlier $y$.
Decide whether the rate is constant.
Name the kind of function.
Which of these equations describes a linear function?
Complete the worked solution to decide whether the table $x$: $1, 2, 3, 4$ and $y$: $28, 46, 76, 118$ is linear.
Find the change in $y$ from $x = 1$ to $x = 2$.
$46 - 28 =$ p
Neighboring rows, one unit apart in $x$.
Find the change from $x = 2$ to $x = 3$.
$76 - 46 =$ q
The next pair of rows.
Find the change from $x = 3$ to $x = 4$.
$118 - 76 =$ r
The last pair of rows. The three changes are not equal, so the function is nonlinear.
Is the function in this table linear? $\begin{array}{c|cccc} x & 1 & 2 & 3 & 4 \\ \hline y & 13 & 25 & 45 & 73 \end{array}$
Find the differences between neighboring $y$-values in this table, then decide whether the function could be linear. $\begin{array}{c|cccc} x & 0 & 1 & 2 & 3 \\ \hline y & 12 & 11 & 2 & -15 \end{array}$
Differences: d1, d2, d3.
This table comes from a linear function. Its $x$-values are not evenly spaced. What is its rate of change? $\begin{array}{c|cccc} x & 0 & 1 & 4 & 10 \\ \hline y & 9 & 11 & 17 & 29 \end{array}$
Answer:
A tall candle burns down at a steady rate. It is $35$ cm tall after $3$ hours and $29$ cm tall after $5$ hours. How tall is it, in centimeters, after $6$ hours?
Answer:
A camera tracks how far a falling object has dropped. After $1, 2, 3$ and $4$ seconds it has dropped $175, 350, 525$ and $700$ feet. Is the distance dropped a linear function of time?
Lesson test: one question per skill, one attempt each, no hints. Your answers are checked when you submit.
This table comes from a linear function. Its $x$-values are not evenly spaced. What is its rate of change? $\begin{array}{c|cccc} x & 2 & 3 & 5 & 9 \\ \hline y & 29 & 38 & 56 & 92 \end{array}$
Answer:
You can decide whether a function is linear from a table, a graph or an equation. Without looking: what do you check in a table, and what does a nonlinear graph look like?
16. Your turn: is the table $x$: $0, 1, 2, 3$ and $y$: $10, 9, 6, 1$ linear?, step 3
$-1 \ne -3 \ne -5 \Rightarrow \text{nonlinear}$
The drops get bigger each step.
16. Your turn: is the table $x$: $0, 1, 2, 3$ and $y$: $10, 9, 6, 1$ linear?, step 4
$y = 10 - x^{2}$
Each $y$ is $10$ minus $x$ squared: a squared input is nonlinear.