Back to the on-screen lesson ·
Increasing, decreasing, flat and steep, described in words.
Paper packet. Every task here also exists on screen, where it is checked automatically; answers written on paper are not assessed by Nydus. When you are back at a device, enter your answers there.
In this lesson you read a graph and describe what it says in words: where it rises, where it falls, where it is flat, where it changes fastest. This runs the modeling of the last lesson backward, and it is the harder direction: a graph gives you everything at once, and saying what happened in order is a skill in itself. You will also sketch a graph from a story.
You can read a point on a graph: the first number tells you how far to go across, and the second tells you how far to go up. You know that the slope of a line is the change in $y$ divided by the change in $x$, and that a function gives one output for each input. In the last lesson you turned a story into an equation. In this lesson you go the other way. You start from a graph and tell the story it holds: what was going up, what was going down, what stopped, and when things happened fast or slowly. You will also sketch a graph from a story told in words.
| Term | What it means |
|---|---|
| Increasing | The graph goes up as you read from left to right: the output gets bigger as the input grows. |
| Decreasing | The graph goes down from left to right: the output gets smaller as the input grows. |
| Constant | The graph is flat (horizontal): the output does not change for a while. |
| Rate of change | How fast the output changes for each unit of input. On a graph it is the steepness. |
| Distance-time graph | A graph with time across the bottom and distance (from a starting place) up the side. Its steepness is a speed. |
| Qualitative graph | A sketch that shows the shape of a relationship (up, down, flat, steep) without exact numbers. |
Every graph of a function has an input across the bottom and an output up the side. Reading it as a story means walking along it from left to right, one piece at a time, and saying what the output does as the input grows. There are only a few things it can do:
The words you use depend on what the axes measure. On a graph of distance from home against time, rising means moving away from home, falling means coming back, flat means standing still, and steepness is speed. On a graph of the water in a bathtub, rising means filling, falling means draining, and steepness is gallons per minute. So the first job is always to read the labels on the axes. The same shape tells a different story on a different graph.
One warning to keep in mind all through the lesson: a graph is not a picture of the place. A distance-time graph that goes up does not mean the person climbed a hill. It means their distance from the start grew.
Another way: words
A story can be told in words: "Sam walked to the store slowly, stayed there for a while, then ran home." That is rising gently, flat, then falling steeply back to zero.
Another way: table
The same story as a table of corner points: at $0$ min, $0$ ft; at $12$ min, $1200$ ft; at $20$ min, $1200$ ft; at $24$ min, $0$ ft. The equal distances at $12$ and $20$ minutes are the flat piece.
Break the graph into pieces wherever its direction or steepness changes. The points where one piece ends and the next begins are the corner points. Then describe each piece on its own, in order.
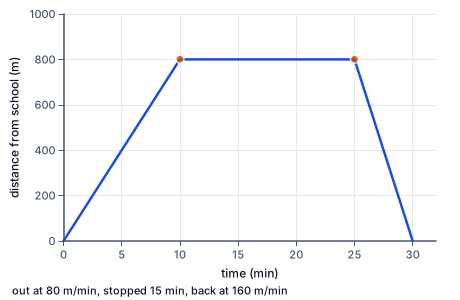
Suppose a graph of Tia's distance from school joins these corner points: $(0, 0)$, $(10, 800)$, $(25, 800)$ and $(30, 0)$, with time in minutes and distance in meters. The first piece rises: Tia moves away from school, $800$ meters in $10$ minutes. The second piece is flat from minute $10$ to minute $25$: she is $800$ meters away for $15$ minutes, so she has stopped, perhaps at a friend's house. The last piece falls back to $0$: she returns to school, covering $800$ meters in only $5$ minutes.
Look at the chart of Tia's story. Time runs across the bottom and her distance from school runs up the side. Follow the line from the origin: it climbs to the first dot at $(10, 800)$, runs level to the second dot at $(25, 800)$, then drops to the time axis at minute $30$. The dots are the corner points, where the story changes. Compare the two slanted pieces: the one on the right is twice as steep, because it covers the same $800$ meters in half the time.
Notice what the flat piece does not mean. It does not mean she was walking along level ground, and it does not mean she went back. A flat piece on any graph means the output is not changing. On a graph of money in a savings account, a flat piece means no deposits and no withdrawals that week. On a graph of temperature, it means the temperature held steady.
The steepness of a piece is its rate of change: the change in output divided by the change in input. For a straight piece you can compute it from its two corner points, exactly like a slope.
In Tia's story, the first piece has a rate of $800 \div 10 = 80$ meters per minute. The last piece falls $800$ meters in $5$ minutes, a rate of $-160$ meters per minute. The minus sign says she is getting closer to school, and the size, $160$, says she is going twice as fast as on the way out. That matches the picture: the last piece is steeper than the first. She probably ran back.
To compare steepness, compare the rates, not the lengths of the pieces. A piece can cover more distance and still be less steep, if it takes much longer. Walking $3$ miles in $2$ hours ($1.5$ miles per hour) is less steep than jogging $2$ miles in $\frac{1}{2}$ hour ($4$ miles per hour).
When a piece of a graph is curved, its steepness changes as you move along it. There are four shapes worth knowing by name.
You can check a curve's shape with a table. If the output changes by $30$, then $20$, then $12$ in equal time steps, the changes are shrinking, so the graph is flattening. The rate is still positive if the output is still going up; it is the size of the change that shrinks. That is exactly the difference between a linear function, whose changes stay equal, and a nonlinear one.
Reading a graph as a story.
Sketching a graph from a story runs the same steps backward: choose the axes, mark where the story starts, then draw one piece for each part of the story, rising, falling or flat, steep where things happen fast.
Why this works. The height of the graph is the output, so going up means the output grew, and a horizontal piece means it stayed the same. The steepness is change in output over change in input, which is the rate.
How to check. Read your story back against the graph, piece by piece: every corner point should match a moment where something changed. Check the units of every rate. Check that the pieces join up: a distance cannot jump from one value to another with no time passing. And check the story makes sense: a walk home should end at distance $0$, and a speed of $300$ miles per hour on a bicycle means a reading mistake.
A family drives from home on an interstate highway, and a phone app logs their distance from home. The graph has corner points $(0, 0)$, $(2, 130)$, $(2.5, 130)$ and $(4, 220)$, with time in hours and distance in miles. The first piece rises at $130 \div 2 = 65$ miles per hour. The flat piece, from hour $2$ to hour $2.5$, is a $30$-minute rest stop. The last piece rises $220 - 130 = 90$ miles in $1.5$ hours, which is $60$ miles per hour: a little less steep, maybe because of traffic near a city. Reading the graph this way tells you the whole trip without anyone writing it down.
On most of the Atlantic coast of the United States, the sea rises and falls about twice a day, and a tide chart graphs the water height in feet against the time. The graph is curved, not straight. Sailors use the rule of twelfths: over the roughly $6$ hours from low tide to high tide, the water rises about $\frac{1}{12}$ of the total in the first hour, $\frac{2}{12}$ in the second, $\frac{3}{12}$ in the third and fourth, $\frac{2}{12}$ in the fifth and $\frac{1}{12}$ in the sixth. For a tide that rises $6$ feet, that is $0.5$, $1$, $1.5$, $1.5$, $1$ and $0.5$ feet. So the graph is flat near low and high tide and steepest in the middle. A boater crossing a shallow sandbar reads that story from the chart: the water comes in fastest in the middle hours, so waiting one extra hour then gains the most depth.
A fitness watch graphs heart rate, in beats per minute, during a run. A common rough guide for the highest safe heart rate is $220$ minus your age, so for a $14$-year-old it is about $206$. A typical graph starts near $75$ at rest, rises steeply to about $150$ during a $5$-minute warm-up (a rate of about $15$ beats per minute, each minute), stays nearly flat while the runner keeps a steady pace, then falls during the cooldown. A coach reads the flat piece as steady effort and the falling piece as recovery: the faster the heart rate falls in the first minute after stopping, the fitter the runner usually is.
Reading the graph as a picture. A distance-time graph that goes up and down is not a hill. Up means farther from the start, down means closer.
Reading a flat piece as moving. Flat means the output is not changing. On a distance-time graph, that is standing still.
Reading a falling piece as slowing down. On a distance-time graph, falling means coming back toward the start, and it can be fast. Slowing down shows as a piece getting less steep.
Comparing lengths instead of rates. The piece that covers more distance is not always the steeper one. Divide by the time first.
Confusing a rising graph with a rising rate. A graph can go up while its steepness goes down: still growing, but more slowly.
Maya's distance from home is graphed with corner points $(0, 0)$, $(10, 1500)$, $(25, 1500)$ and $(35, 0)$: minutes across, feet up. Read the axes.
$\text{input: time (min)}, \quad \text{output: distance from home (ft)}$
The axes decide the words: rising means moving away from home.
Describe the first piece and find its rate.
$\dfrac{1500 - 0}{10 - 0} = 150 \text{ ft per min}$
It rises, so Maya walks away from home at $150$ feet each minute.
Describe the second piece.
$25 - 10 = 15 \text{ min at } 1500 \text{ ft}$
The graph is flat, so the distance does not change: she stops for $15$ minutes.
Describe the third piece and find its rate.
$\dfrac{0 - 1500}{35 - 25} = -150 \text{ ft per min}$
It falls to $0$, so she walks back home. The minus sign means getting closer.
Tell the story in order.
$\text{away } (150) \;\to\; \text{stop } 15 \text{ min} \;\to\; \text{home } (150)$
Maya walks out, stops for $15$ minutes, and walks home at the same speed, since the two rates have the same size.
A mug of cocoa's temperature is read every $5$ minutes: $180$, $150$, $130$, $118$, $110\,^{\circ}$F. Read the axes.
$\text{input: time (min)}, \quad \text{output: temperature } (^{\circ}\text{F})$
The story is about how hot the cocoa is as time passes.
Find the change in the first $5$ minutes.
$150 - 180 = -30$
A negative change means the graph falls: the cocoa cools.
Find the change in the next $5$ minutes.
$130 - 150 = -20$
It is still falling, but by less.
Find the change in the third $5$ minutes.
$118 - 130 = -12$
Still falling, by less again.
Find the change in the last $5$ minutes.
$110 - 118 = -8$
The drops keep shrinking.
Compare the sizes of the drops.
$30 > 20 > 12 > 8$
Unequal drops mean the graph is curved, not straight, and shrinking drops mean it gets less steep.
Tell the story.
$\text{falling, fast at first, then more and more slowly}$
The cocoa cools quickly while it is very hot and slowly as it nears room temperature, so the graph flattens out.
Story: "Carlos walked $0.5$ mile to a friend's house in $10$ minutes, stayed $20$ minutes, biked $3$ miles farther in $15$ minutes, then biked $3.5$ miles home in $20$ minutes." Choose the axes.
$\text{time (min) across}, \quad \text{distance from home (mi) up}$
Every part of the story is a change in distance over some time.
Plot the start and the end of the walk.
$(0,\ 0) \to (10,\ 0.5)$
He starts at home and is $0.5$ mile away after $10$ minutes.
Find the walking speed.
$0.5 \div 10 = 0.05 \text{ mi per min}$
The steepness of the first piece is his walking speed.
Draw the visit as a flat piece.
$(10,\ 0.5) \to (30,\ 0.5)$
Staying put for $20$ minutes means the distance does not change.
Plot the bike ride away.
$(30,\ 0.5) \to (45,\ 3.5)$
He goes $3$ miles farther, so the distance rises to $0.5 + 3 = 3.5$.
Find the speed on the ride away.
$3 \div 15 = 0.2 \text{ mi per min}$
This piece is four times as steep as the walk.
Plot the ride home.
$(45,\ 3.5) \to (65,\ 0)$
Going home brings the distance back down to $0$.
Find the speed on the ride home.
$3.5 \div 20 = 0.175 \text{ mi per min}$
The piece falls, so the rate is $-0.175$; its size is the speed.
Rank the pieces from steepest to flattest.
$0.2 > 0.175 > 0.05 > 0$
Compare speeds, not distances: the ride away is steepest, the visit is flat.
Check the sketch against the story.
$0.5 + 3 - 3.5 = 0; \quad 10 + 20 + 15 + 20 = 65$
The graph ends at home, and the times add up to the whole trip.
Describe the first piece and find its rate.
$\dfrac{2400 - 1200}{2 - 0} = 600 \text{ ft per hour}$
It rises: the hiker climbs $600$ feet each hour.
Describe the second piece.
$3 - 2 = 1 \text{ hour at } 2400 \text{ ft}$
Flat: the height does not change, so the hiker rests for an hour.
Describe the third piece and find its rate.
Tell the story in order.
Ben's distance from home is graphed against time. From minute $0$ to minute $15$ the graph rises. From minute $15$ to minute $20$ it is flat. Then it rises again until minute $34$. What happened?
A graph of a car-free trail ride joins these corner points (time in hours, distance from the start in miles). $\begin{array}{c|cccc} \text{time (h)} & 0 & 3 & 4 & 6 \\ \hline \text{distance (mi)} & 0 & 36 & 36 & 62 \end{array}$ Complete the worked solution that turns the graph into a story.
Find the speed on the first piece.
$36 \div 3 =$ r miles per hour
A rising piece is riding; miles over hours is the speed.
Find how long the flat piece lasts.
$4 - 3 =$ s h
A flat piece means the distance did not change: a stop.
Find the speed on the last piece.
$(62 - 36) \div 2 =$ t miles per hour
Use the last piece's own change in distance and change in time.
A sunflower's height is graphed week by week. It was $15$ cm tall at the start, $21$ cm after week $1$, $25$ cm after week $2$ and $27$ cm after week $3$. The graph rises steeply at first and then less and less steeply. What is happening to its rate of change?
Lena's distance-time graph for a skateboard ride rises $200$ feet each minute until minute $5$, and after that it is steeper, rising $400$ feet each minute. What does the steeper piece tell you?
A hot tub is drained at a steady rate. It held $225$ gallons at the start and $175$ gallons after $2$ minutes. The graph of gallons against minutes is a falling straight line. How many gallons drain each minute, and after how many minutes (from the start) is the tub empty?
It drains rate gallons per minute and is empty after time minutes.
A distance-time graph of a bike ride is made of straight pieces joining these corner points. Time is in hours and distance from the start is in miles. $\begin{array}{c|cccc} \text{time (h)} & 0 & 3 & 4 & 8 \\ \hline \text{distance (mi)} & 0 & 27 & 27 & 51 \end{array}$ What was the rider's speed on the last piece, in miles per hour?
On the last piece the speed was answer miles per hour.
A hiking group's walk is drawn as a distance-time graph. Part $1$: it covers $6$ miles in the first $6$ hours. Part $2$: it covers $15$ miles in the next $3$ hours. Which part of the graph is steeper, and what was the group's speed on it?
Part part is steeper, at speed miles per hour.
Lesson test: one question per skill, one attempt each, no hints. Your answers are checked when you submit.
A distance-time graph of a bike ride is made of straight pieces joining these corner points. Time is in hours and distance from the start is in miles. $\begin{array}{c|cccc} \text{time (h)} & 0 & 4 & 5 & 10 \\ \hline \text{distance (mi)} & 0 & 56 & 56 & 121 \end{array}$ What was the rider's speed on the last piece, in miles per hour?
On the last piece the speed was answer miles per hour.
You can describe in words what a graph shows. Without looking: what does a flat section mean, and what does a steeper section mean about the rate?
16. Your turn: a hiker's height above sea level has corner points $(0, 1200)$, $(2, 2400)$, $(3, 2400)$ and $(5, 1600)$, with hours across and feet up. Tell the story., step 3
$\dfrac{1600 - 2400}{5 - 3} = -400 \text{ ft per hour}$
It falls: the hiker goes down $400$ feet each hour.
16. Your turn: a hiker's height above sea level has corner points $(0, 1200)$, $(2, 2400)$, $(3, 2400)$ and $(5, 1600)$, with hours across and feet up. Tell the story., step 4
$\text{climb } 600 \;\to\; \text{rest } 1 \text{ h} \;\to\; \text{descend } 400$
Up fast, a rest at the top, then down more slowly than the climb.