Back to the on-screen lesson ·
Counting by two categories at once, and reading relative frequencies.
Paper packet. Every task here also exists on screen, where it is checked automatically; answers written on paper are not assessed by Nydus. When you are back at a device, enter your answers there.
In this lesson you organize data sorted two ways, such as by grade and by whether students have a phone, and use relative frequencies to look for an association. The care needed is in which total you divide by: the row, the column or the whole table give three different percents, and they answer three different questions.
You can find a percent of a number and write a part of a whole as a percent: $18$ out of $40$ is $\frac{18}{40} = 0.45$, or $45\%$. You know that a percent only means something once you know what the whole is. You have organized data in tables and bar graphs, and you have used a scatter plot to look for a pattern between two measurements such as height and arm span. This lesson is about data that is not measured but sorted: each person answers yes or no, or falls into one group or another, and we sort them by two questions at once.
| Term | What it means |
|---|---|
| Categorical data | Data that puts each item in a group, such as grade level or yes/no, rather than measuring it. |
| Two-way table | A table that counts items sorted by two categories at once: one along the rows, one along the columns. |
| Cell | One box inside the table: the count of items in one row group and one column group. |
| Row total, column total, grand total | The sum across a row, the sum down a column, and the count of everything. |
| Relative frequency | A count divided by a total, written as a fraction, decimal or percent. |
| Row percent / column percent | A cell divided by its row total, or by its column total. |
| Association | A link between the two categories: the percents in one change from group to group of the other. |
Suppose a middle school asks $200$ students two questions: What grade are you in? and Do you have a phone of your own? Each student lands in exactly one of four boxes: 6th grade with a phone, 6th grade without, 8th grade with, 8th grade without. A two-way table shows those four counts, with one question down the side and the other across the top:
| Phone | No phone | Total | |
|---|---|---|---|
| 6th grade | 36 | 54 | 90 |
| 8th grade | 88 | 22 | 110 |
| Total | 124 | 76 | 200 |
The totals do bookkeeping. Each row adds across to its row total, each column adds down to its column total, and both sets of totals add to the grand total, $200$.
The counts alone can mislead, because the groups are different sizes. So we turn counts into relative frequencies: a count divided by a total. The key idea of the whole lesson is that there are three totals to divide by, the row total, the column total and the grand total, and each one answers a different question. Pick the total that matches the group the question is about.
When the row percents change a lot from one row to the next, the two categories are associated. Here $40\%$ of 6th graders have a phone but $80\%$ of 8th graders do, so grade and phone ownership are associated.
Another way: a diagram
Picture the $200$ students as dots in a rectangle. Split it once, top from bottom, by grade. Then split each part, left from right, by phone. The four pieces are the four cells, and their areas show the counts.
Another way: fractions
Each relative frequency is a fraction with a cell on top and a total underneath. Only the bottom changes between the three kinds: $\frac{36}{90}$, $\frac{36}{124}$ or $\frac{36}{200}$.
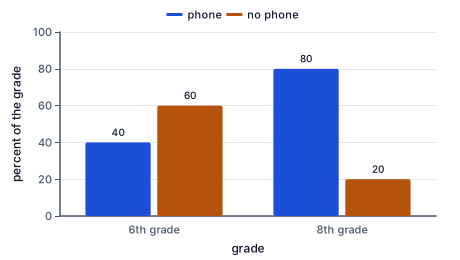
Divide each cell of the phone survey by its row total. For 6th grade, $36 \div 90 = 40\%$ have a phone and $54 \div 90 = 60\%$ do not. For 8th grade, $88 \div 110 = 80\%$ have one and $22 \div 110 = 20\%$ do not.
The bar chart shows those row percents. Each grade's two bars add to $100\%$, because every student in that grade either has a phone or does not. Now compare the blue bars across the two grades: $40\%$ against $80\%$. The 8th-grade blue bar is twice as tall. That big difference is what an association looks like. If grade made no difference, the blue bars would be about the same height, and so would the orange ones.
Notice that the chart uses percents, not counts. Counts would make the 8th grade look bigger simply because more 8th graders were asked. Percents put both grades on the same scale of $100$.
The same cell, $36$ (6th graders with a phone), gives three different percents:
The trick is to read the question for the words that name the whole. "Of the 6th graders" or "what percent of 6th graders" means divide by the 6th-grade row. "Of those with a phone" means divide by the phone column. "Of all students" means divide by the grand total. The group named after of is almost always the whole.
Row percents in one row add to $100\%$. Column percents in one column add to $100\%$. Mixing them up is the most common mistake with two-way tables, and it can turn a true statement into a false one.
Often you are given only some of the numbers. Because every row and column must add up, a missing cell is always a total minus what you know. Suppose a movie theater counts $150$ customers: $60$ are children, $45$ children and $50$ adults buy popcorn. That is enough to fill the whole table. There are $150 - 60 = 90$ adults; $60 - 45 = 15$ children skip popcorn; $90 - 50 = 40$ adults skip it; and the popcorn column holds $45 + 50 = 95$ people.
Work in an order where each step has only one unknown. Row totals first is often easiest. When you finish, check that the rows and the columns give the same grand total. If they do not, one subtraction is wrong.
You can rewrite a whole two-way table with percents in place of counts. For a row relative frequency table, divide every cell by its own row total. The phone survey becomes:
| Phone | No phone | Total | |
|---|---|---|---|
| 6th grade | 40% | 60% | 100% |
| 8th grade | 80% | 20% | 100% |
Every row now ends in $100\%$, which is a quick check that you divided by the right totals. To compare the grades you read down a column: the Phone column goes from $40\%$ to $80\%$. A column relative frequency table divides by column totals instead, so every column ends in $100\%$, and it answers questions that start with a column group, such as "of the phone owners, how many are 8th graders?"
An association says two categories go together. It does not say one causes the other. In the phone survey, being older does not by itself hand out phones; parents decide, and they tend to decide yes as children get older. In other data a third thing drives both. More people who carry umbrellas wear raincoats, but umbrellas do not cause raincoats: rain causes both.
Also watch the size of the groups. A percent from $5$ people can swing wildly: one person changes it by $20$ points. Percents from hundreds of people are much steadier, so a difference between them means more.
How to check. The cells of each row add to the row total, and the cells of each column add to the column total. The row percents of one row add to $100\%$. And the answer must make sense: a percent of a group can never be more than $100\%$, and a part of a small group cannot be a big count.
In 1954 about $400{,}000$ American schoolchildren took part in a test of Jonas Salk's polio vaccine. Half were given the vaccine and half a harmless salt-water shot, and nobody knew who got which. Of $200{,}745$ vaccinated children, $33$ caught paralytic polio. Of $201{,}229$ children given the salt water, $115$ did. The groups were almost the same size, but the fair comparison is still the rate: about $16$ cases per $100{,}000$ vaccinated children against about $57$ per $100{,}000$ unvaccinated. That strong association, in a trial where chance alone decided who got the vaccine, convinced doctors that the vaccine worked.
When the Titanic sank in 1912, survival was strongly associated with ticket class. A widely used data set lists $203$ survivors among $325$ first-class passengers, about $62\%$, but only $178$ among $706$ third-class passengers, about $25\%$. Counting survivors alone would hide this: the two classes had similar numbers of survivors. Only the row percents show that a first-class passenger was about two and a half times as likely to survive.
A school board thinking about starting middle school later asked $500$ families. Of $300$ families with a child in 6th or 7th grade, $135$ were in favor, which is $45\%$. Of $200$ families with an 8th grader, $130$ were in favor, which is $65\%$. More younger-grade families said yes in total ($135$ against $130$), but a greater share of 8th-grade families did. The board reports both percents, because each group wants to know how people like them feel.
Comparing counts instead of percents. $30$ yes answers out of $100$ is a smaller rate than $20$ out of $40$.
Dividing by the wrong total. "What percent of 8th graders" uses the 8th-grade row, not the grand total or a column.
Reading a column percent as a row percent. "$29\%$ of phone owners are 6th graders" is not "$29\%$ of 6th graders own phones."
Calling any difference an association. $41\%$ against $39\%$ is about the same; look for a clear gap.
Treating association as cause.
A theater counts $150$ customers; $60$ are children. Find the adults.
$150 - 60 = 90$
Everyone is a child or an adult.
$45$ children bought popcorn. Find the children who did not.
$60 - 45 = 15$
The children's row adds to $60$.
$50$ adults bought popcorn. Find the adults who did not.
$90 - 50 = 40$
The adults' row adds to $90$.
Add the popcorn column.
$45 + 50 = 95$
Children plus adults who bought popcorn.
Add the no-popcorn column.
$15 + 40 = 55$
Children plus adults who did not.
Check the grand total from the columns.
$95 + 55 = 150$
It matches the $150$ customers, so the table is right.
Use the phone survey. Add the 6th-grade row.
$36 + 54 = 90$
The row total is the whole for questions about 6th graders.
Find the percent of 6th graders with a phone.
$36 \div 90 = 0.4 = 40\%$
Divide the cell by its row total.
Find the percent of 6th graders without one.
$54 \div 90 = 0.6 = 60\%$
The row's two percents add to $100\%$.
Add the 8th-grade row.
$88 + 22 = 110$
A different whole for the second group.
Find the percent of 8th graders with a phone.
$88 \div 110 = 0.8 = 80\%$
Divide by the 8th-grade total, not by $90$.
Find the percent of 8th graders without one.
$22 \div 110 = 0.2 = 20\%$
Again the two add to $100\%$.
Compare the same column across the rows.
$40\% \text{ against } 80\%$
A large gap: grade and phone ownership are associated.
A clinic's records: $240$ people had a flu shot and $12$ of them got the flu; $160$ did not and $32$ of them got it. Find the flu rate with the shot.
$12 \div 240 = 0.05 = 5\%$
Divide by the shot group's row total.
Find the flu rate without the shot.
$32 \div 160 = 0.2 = 20\%$
Divide by the no-shot row total.
Compare the row percents.
$5\% \text{ against } 20\%$
People without the shot got the flu four times as often: an association.
Add the flu column.
$12 + 32 = 44$
$44$ people in all got the flu.
Find what percent of the flu cases had the shot.
$12 \div 44 \approx 0.27 = 27\%$
This is a column percent: the whole is the flu cases.
Find what percent of everyone had the shot and got the flu.
$12 \div 400 = 0.03 = 3\%$
The whole is all $240 + 160 = 400$ people.
Decide which percent answers "does the shot help?"
$\text{rows: } 5\% \text{ and } 20\%$
The question compares the two groups, so it needs row percents.
Say why the column percent misleads here.
$27\% \text{ of flu cases had the shot}$
More people had the shot, so some cases come from that group even though its rate is low.
Find the percent of left-handers who play.
$6 \div 20 = 0.3 = 30\%$
Divide by the left-handed row total.
Find the percent of right-handers who play.
$24 \div 80 = 0.3 = 30\%$
Divide by the right-handed row total.
Compare the row percents.
State the answer.
A camp asked $40$ first-time campers and $60$ returning campers whether they wanted a swim class. $20$ first-timers and $54$ returning campers said yes. Is there an association between being a returning camper and wanting a swim class?
A zoo asked $223$ visitors whether they visited the aquarium. $89$ of them were members. $15$ members and $36$ non-members visited the aquarium. Complete the worked solution to find the missing counts.
Subtract the members who visited from all members.
$89 - 15 =$ p
That is the members who did not visit the aquarium.
Subtract the members from all visitors.
$223 - 89 =$ q
That is the non-members' row total.
Subtract the non-members who visited from that row total.
$\text{non-members total} - 36 =$ r
That is the non-members who did not visit.
A survey asked 7th and 8th graders whether they bike to school. | | Bikes | Does not bike | Total | |---|---|---|---| | 7th grade | $13$ | $32$ | $45$ | | 8th grade | $36$ | ? | $74$ | | Total | ? | $70$ | $119$ | Find the two missing numbers.
8th graders who do not bike: n. Total who bike: s.
Of the $60$ eighth graders in a survey, $24$ do not play on a school team. What percent of the eighth graders do play on a team?
c eighth graders play, which is p %.
In a survey, $45\%$ of the $60$ sixth graders play a musical instrument. How many sixth graders do not play one, and what percent of the sixth graders is that?
n sixth graders do not play, which is p %.
Last month $45$ of the $100$ students who ride the bus were late at least once, and $12$ of the $75$ students who are driven to school were late at least once. Find the percent late in each group.
Bus riders: p % late. Car riders: q % late.
An online store emailed a coupon to $100$ customers and sent nothing to another $225$. That week $55$ of the emailed customers and $36$ of the others bought something. What percent of each group bought, and how many percentage points higher is the emailed group?
Emailed: p %. Not emailed: q %. Difference: d points.
Lesson test: one question per skill, one attempt each, no hints. Your answers are checked when you submit.
A cafeteria survey sorted students by grade and lunch. | | Hot lunch | Packed lunch | |---|---|---| | 7th grade | $49$ | $40$ | | 8th grade | $38$ | $60$ | Of the students who pack their lunch, what percent are in 8th grade?
Column total: t. Percent in 8th grade: p %
You can read a two-way table and compute a relative frequency. Without looking: if you want the percent of phone owners who are in 8th grade, which total do you divide by?
18. Your turn: $20$ left-handed students include $6$ who play an instrument, and $80$ right-handed students include $24$ who play one. Is there an association between handedness and playing?, step 3
$30\% = 30\%$
The rates are the same even though the counts differ.
18. Your turn: $20$ left-handed students include $6$ who play an instrument, and $80$ right-handed students include $24$ who play one. Is there an association between handedness and playing?, step 4
$\text{no association}$
Handedness makes no difference to the rate of playing.