Back to the on-screen lesson ·
Surprise in bits, the entropy of a distribution as the average surprise, and why the surprise has to be a logarithm.
Paper packet. Every task here also exists on screen, where it is checked automatically; answers written on paper are not assessed by Nydus. When you are back at a device, enter your answers there.
By the end of this lesson you will be able to explain why the surprise of an outcome is $\log_2(1/p)$ bits and assemble the argument that no other function will do, define the entropy $H(X)$ as the average surprise, compute it exactly for uniform and dyadic distributions and read it off a program that computes it, and state what it promises: the least average number of bits per symbol that any lossless description of $X$ can achieve.
A random variable with a probability mass function, the expected value as a probability-weighted average, and the rule that independent events multiply their probabilities. This lesson takes one more function of an outcome, its surprise, and averages it.
The surprise of an outcome of probability $p$ is $\log_2 (1/p)$. The entropy $H(X)$ is the average surprise over the distribution of $X$. A bit is the unit: the surprise of a fair coin landing heads. A distribution whose probabilities are all powers of two is dyadic, and its entropy is a whole number of halves.
An outcome of probability $p$ carries surprise $\log_2 (1/p)$ bits: an event of probability $1/8$ is three yes-or-no questions' worth of news, a certain event carries none. The entropy of a random variable $X$ with pmf $p$ is the average surprise, $$H(X) = \sum_x p(x) \log_2 \frac{1}{p(x)} = -\sum_x p(x) \log_2 p(x),$$ with the convention $0 \log 0 = 0$. A fair coin has $H = 1$ bit; a fair eight-sided die $H = \log_2 8 = 3$ bits; the distribution $(\tfrac{1}{2}, \tfrac{1}{4}, \tfrac{1}{4})$ has $H = \tfrac{1}{2} \cdot 1 + \tfrac{1}{4} \cdot 2 + \tfrac{1}{4} \cdot 2 = 1.5$ bits. Entropy depends only on the probabilities, never on the labels of the outcomes, and it is never negative. Its operational meaning, proved in the source coding lessons, is that $H(X)$ is the least average number of bits any code can spend per symbol of $X$.
Another way: picture
Twenty questions: a fair eight-sided die needs exactly three yes-or-no questions, $\log_2 8$. A loaded die that shows $1$ half the time needs fewer on average, because you ask 'is it $1$?' first. Entropy counts the average questions of the best strategy.
Another way: steps
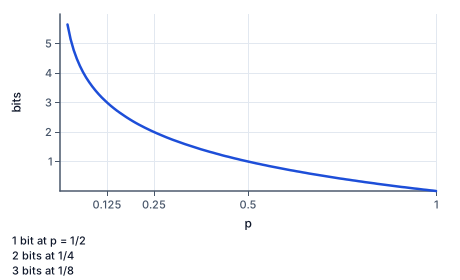
Three requirements pin the formula down. Surprise must decrease as probability grows: news of a likely event is dull. It must be zero for a certain event. And for two independent events it must add: learning both should cost the sum of learning each, while their probability multiplies, $p(A \cap B) = p(A)\, p(B)$. A function $s$ with $s(pq) = s(p) + s(q)$, $s(1) = 0$ and $s$ decreasing must be $s(p) = -c \log p$ for some constant $c > 0$. Choosing base $2$ ($c = 1$) measures surprise in bits, the number of fair-coin flips' worth of news. Base $e$ gives nats and base $10$ gives hartleys; convert with $\log_2 x = \ln x / \ln 2 \approx 1.443 \ln x$.
| Probability $p$ | Surprise $\log_2 (1/p)$ | Read as |
|---|---|---|
| $1$ | $0$ | nothing new |
| $1/2$ | $1$ bit | one fair coin flip |
| $1/4$ | $2$ bits | two flips |
| $1/8$ | $3$ bits | three flips |
| $0.3$ | $1.737$ bits | between one and two flips |
| $0.1$ | $3.322$ bits | a one-in-ten event |
| $0.01$ | $6.644$ bits | a rare event is big news |
Look at the last two rows: dividing the probability by $10$ adds the same $3.322$ bits each time, because $\log_2 (1/0.01) = 2 \log_2 10$. That additive behaviour is exactly what a logarithm is for, and it is why the curve is so steep near $p = 0$.
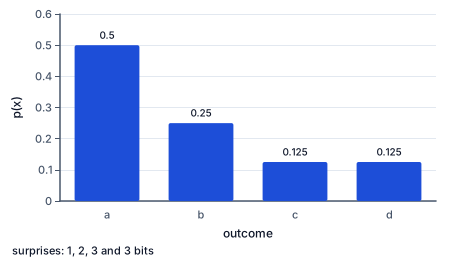
Entropy multiplies each surprise by how often it occurs, then adds. Lay the distribution out as a bar chart and write the surprise above each bar:
| Outcome | $p$ | $\log_2 (1/p)$ | $p \log_2 (1/p)$ |
|---|---|---|---|
| a | $0.5$ | $1$ | $0.5$ |
| b | $0.25$ | $2$ | $0.5$ |
| c | $0.125$ | $3$ | $0.375$ |
| d | $0.125$ | $3$ | $0.375$ |
| sum | $1$ | $H = 1.75$ |
The last column adds up to the entropy, $1.75$ bits: less than the $2$ bits of the uniform distribution on four outcomes, because the tall bar is predictable. Whenever the probabilities are powers of $2$ (a dyadic distribution) every surprise is a whole number and the sum is exact. Otherwise you need a few logarithms:
| $n$ | $3$ | $5$ | $6$ | $7$ | $10$ | $12$ | $20$ |
|---|---|---|---|---|---|---|---|
| $\log_2 n$ | $1.585$ | $2.322$ | $2.585$ | $2.807$ | $3.322$ | $3.585$ | $4.322$ |
together with the rule $\log_2 (a/b) = \log_2 a - \log_2 b$: $\log_2 (10/3) = 3.322 - 1.585 = 1.737$, and $\log_2 (1/0.2) = \log_2 5 = 2.322$. Every decimal probability in this course is a fraction with a small denominator, so these seven values are all you ever need.
The practice items come in three shapes.
Common mistakes
The commonest slip is adding the surprises without weighting them: the surprises of $(0.5, 0.3, 0.2)$ add to about $5$, and the entropy is $1.485$, because each surprise counts only as often as its outcome occurs. The second is reading entropy as the number of outcomes; ten equally likely outcomes have entropy $\log_2 10 \approx 3.32$ bits, not $10$. The third is a negative entropy from a dropped minus sign: every $\log_2 p$ is negative or zero, so every term of $-\sum p \log_2 p$ is at least $0$. And a base slip — natural or common logarithms — gives an answer in nats or hartleys that is a fixed factor too small; bits need base $2$.
Surprises: $\log_2 2 = 1$, $\log_2 4 = 2$, $\log_2 8 = 3$, $\log_2 8 = 3$ bits.
Dyadic probabilities give whole-number surprises.
Weight each by its probability: $\tfrac{1}{2} \cdot 1 + \tfrac{1}{4} \cdot 2 + \tfrac{1}{8} \cdot 3 + \tfrac{1}{8} \cdot 3$.
The definition, term by term.
$H = 0.5 + 0.5 + 0.375 + 0.375 = 1.75$ bits, less than the $2$ bits of the uniform distribution on four outcomes.
Skew lowers entropy.
Surprises: $\log_2 2 = 1$; $\log_2 (10/3) = \log_2 10 - \log_2 3 \approx 3.322 - 1.585 = 1.737$; $\log_2 5 \approx 2.322$.
Rewrite reciprocals with known logarithms.
$H \approx 0.5 \cdot 1 + 0.3 \cdot 1.737 + 0.2 \cdot 2.322 = 0.5 + 0.521 + 0.464 = 1.485$ bits.
Below $\log_2 3 = 1.585$, the uniform maximum.
One symbol has probability $\tfrac{1}{2}$; four others share the remaining $\tfrac{1}{2}$ equally, $\tfrac{1}{8}$ each.
Surprises: $\log_2 2 = 1$ bit and $\log_2 8 = 3$ bits.
Both probabilities are powers of two, so the surprises are whole numbers.
$H = \tfrac{1}{2} \cdot 1 + 4 \cdot \tfrac{1}{8} \cdot 3 = 0.5 + 1.5 = 2$ bits.
The shortcut $(j + 2)/2$ with $j = 2$ agrees.
Surprises: $\log_2 (1/0.7) = \log_2 10 - \log_2 7 = 3.322 - 2.807 = 0.515$; $\log_2 5 = 2.322$; $\log_2 10 = 3.322$.
Write each reciprocal as a quotient of small integers and use the table.
Weighted terms: $0.7 \cdot 0.515 = 0.3605$, $0.2 \cdot 2.322 = 0.4644$, $0.1 \cdot 3.322 = 0.3322$.
$H = 0.3605 + 0.4644 + 0.3322 = 1.157$ bits, well below $\log_2 3 = 1.585$ because the first outcome dominates.
Every face has probability $1/32$ and surprise $\log_2 32 = 5$ bits.
$H = 32 \cdot \tfrac{1}{32} \cdot 5 = 5$ bits.
Match each distribution to its entropy in bits.
| $0$ bits | $1$ bit | $1.5$ bits | $2$ bits | $3$ bits | |
|---|---|---|---|---|---|
| $(1, 0)$ | |||||
| $(\tfrac{1}{2}, \tfrac{1}{2})$ | |||||
| $(\tfrac{1}{2}, \tfrac{1}{4}, \tfrac{1}{4})$ | |||||
| $(\tfrac{1}{4}, \tfrac{1}{4}, \tfrac{1}{4}, \tfrac{1}{4})$ | |||||
| Uniform on $8$ outcomes |
Build the argument that the surprise of an outcome of probability $p$ must be $-c \log p$ for some constant $c > 0$.
This task has no paper form; do it on a device.
This program reads a count and then that many probabilities, one per line, and prints the entropy in bits rounded to four decimals. ``` import math n = int(input()) p = [float(input()) for _ in range(n)] h = 0.0 for q in p: if q > 0: h -= q * math.log2(q) print(round(h, 4)) ``` What does it print when the input is `3`, then `0.5`, `0.25`, `0.25`?
[__output__]
Write each blank here: output:
Which statement about the entropy $H(X)$ of a random variable is correct?
A weather station reports one of $32$ equally likely states every hour, each hour independent of the last. Over $20$ hours, what is the least average number of bits any lossless log format can use to record the readings?
Answer:
Lesson test: one question per skill, one attempt each, no hints. Your answers are checked when you submit.
A source has one symbol of probability $\tfrac{1}{2}$ and $2$ rare symbols that share the other half equally. Fill in the surprise of each kind of symbol, in bits, and what each kind contributes to the entropy.
| Surprise of one symbol (bits) | Contribution to the entropy (bits) | |
|---|---|---|
| The likely symbol | ||
| The rare symbols, together | ||
| The whole source | — |
You can compute the entropy of any small distribution and say why surprise is a logarithm. Say in your own words why the surprises of a distribution are weighted before they are added, and what goes wrong if they are not. Next: the binary entropy function, the entropy of a single biased coin.
13. Your turn: entropy of a fair $32$-sided die, step 2