Turning a practice record into percentages and a plot, reading where the loss happened, and measuring what survives with savings.
Paper packet. Every task here also exists on screen, where it is checked automatically; answers written on paper are not assessed by Nydus. When you are back at a device, enter your answers there.
1. What you will learn
You will turn a practice record into percentages, plot it, say where most of the loss happened, and work out savings, and you will say what the curve cannot tell you about anybody.
2. Where the last lesson left off
In the last lesson the rereading group wrote back 83 percent of a passage after five minutes and 40 percent after a week. Everything between those two numbers is forgetting, and it does not happen at an even pace. This lesson is about its shape, and about why that shape is the reason retrieval is worth the trouble.
3. Words this lesson uses
Term
What it means
Retention
How much of what was studied can still be produced at a check, often as a percentage.
Forgetting curve
A graph of retention against the time since studying.
Check
One attempt to write the material back, at a known time.
Savings
How much less time relearning takes than the first learning did, as a percentage of the first time.
Replication
Repeating an old study to see whether the same result comes out.
4. Steep at first, then flat
In the early 1880s Hermann Ebbinghaus learned lists of nonsense syllables until he could recite them twice without error, then relearned each list after a gap, timing himself. He published the results in 1885. Because he could not always recall a list at all, he measured savings: how much faster the relearning went than the first learning.
Gap since learning
Ebbinghaus's savings
20 minutes
58%
1 hour
44%
About 9 hours
36%
1 day
34%
2 days
28%
6 days
25%
31 days
21%
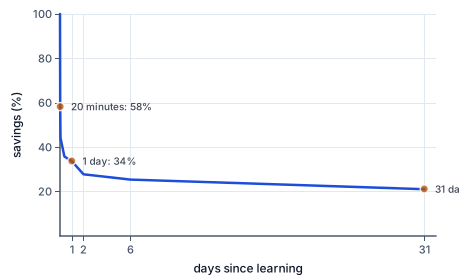
Read down the column. The first hour cost more than the whole month that followed the first day. That is the shape: a steep early drop, then a long, flattening tail. What survives the first days tends to be lost slowly.
Another way: diagram
The percent of the original learning effort saved when relearning lists of nonsense syllables, against the days since they were learned, from Hermann Ebbinghaus's 1885 record. Savings fall from 58 percent after 20 minutes to 44 after an hour and 34 after a day: a steep drop in the first hours. After that the curve almost levels off, at 25 percent after six days and 21 after a month, like a slide's long run-out.
The chart is Ebbinghaus's own record: the steep section in the first hours, then the long, nearly level run-out.
Picture a playground slide: a steep section at the top, then a long, almost level run-out. The steep section is the first hours and days. The run-out is the weeks after. A forgetting curve has that profile.
Another way: story
Someone meets eight new neighbors at a block party. On the walk home they can name six; the next morning, four; a week later, three. A month on, those three are still there. Most of the loss happened overnight.
5. The curve was checked again
One person's data from the 1880s would be a weak base for anything. In 2015 Jaap Murre and Joeri Dros repeated the experiment: one participant spent about 70 hours learning and relearning lists of nonsense syllables, with gaps from 20 minutes to 31 days. The curve came out very like Ebbinghaus's. They also found a small upward bump at the one-day check, which they suggested may reflect sleep.
Two cautions travel with the curve. Nonsense syllables were chosen because they mean nothing; material that means something to you usually fades more slowly, so the percentages are not a timetable for what you learn. And the curve describes material left alone. A successful retrieval changes what happens next, which is the subject of the last lesson in this course.
6. Reading a record, step by step, and how to check it
A record is a few counts at a few checks. To read it:
Turn counts into percentages: written back ÷ studied × 100. With 20 words, each word is 5 percent.
Find each drop: earlier count minus later count.
Set each drop against its gap. A drop of 6 words in one day is steeper than a drop of 4 words over six days.
Name the shape: where the steep part is, and where it flattens.
To check, add the drops back up: the first count minus all the drops must equal the last count. For savings, check that the saving is smaller than the first learning time, so the percentage is under 100.
7. What the shape means for practice
The steep start tells you when a check is most informative. A check a few minutes after studying mostly finds what is still in mind, so it looks good and says little. A check the next day lands after the steepest part of the drop, so what comes back then has already survived the worst of it, and what does not come back is exactly what needs another look.
The flat tail tells you the effort is not wasted. Whatever you manage to produce after a gap tends to be lost slowly, and even what you cannot produce leaves savings behind. The next lesson turns this into a habit: leave a real gap before the check, and keep that gap clean.
8. Picking up an old language
Harry Bahrick (1984) tested 733 people who had studied Spanish in school, from a few months to 50 years earlier. What they retained fell over roughly the first three to six years and then held nearly unchanged for up to 30 years: the flat tail, on the scale of a lifetime.
Savings shows the same thing in a single evening. Work through a fictional case. Maria learned 30 Spanish phrases for a trip to Mexico, and it took her 40 minutes. Two years later she is going back. Covering the English side, she can produce only a few, but relearning all 30 takes 26 minutes. Her savings: 40 − 26 = 14 minutes saved, and 14 ÷ 40 × 100 = 35 percent. Nothing much came back cold, yet a third of the first work did not need doing again.
9. Three wrong readings
The curve is a verdict. A record of one list in one week says how that list went. It says nothing about ability, and everybody's records have this shape; Ebbinghaus's own did.
The line runs on to zero. A curve that is flattening is not falling at its early rate forever. The 31-day savings were still 21 percent. Extending the first day's slope into the future predicts a loss the data does not show.
If I can't recall it, it's gone. Savings says otherwise. Something that will not come back cold can still be relearned faster than the first time.
10. Savings from two relearning times
Write down the two times.
First learning: 30 minutes. Relearning after a week: 21 minutes.
Savings compares the second effort with the first.
Subtract to find the time saved.
30 − 21 = 9 minutes saved
The saving is the work that did not need doing again.
Divide by the first time and multiply by 100.
9 ÷ 30 × 100 = 30 percent
Savings is a share of the first learning time.
Check the answer is sensible.
9 is less than 30, so the savings are under 100 percent
A saving can never be larger than the first effort.
11. Finding where the loss happened
Write the record as percentages.
20 words: 18, 12, 10, 8 at day 0, 1, 2, 7 → 90, 60, 50, 40 percent
Each word of 20 is 5 percent.
Find the first drop and its gap.
Day 0 to 1: 18 − 12 = 6 words in one day
Earlier minus later, and note the length of the gap.
Find the later drop and its gap.
Day 1 to 7: 12 − 8 = 4 words over six days
A longer gap with a smaller drop means the curve is flattening.
Check by adding the drops back.
18 − 6 − 4 = 8, which matches day 7
The drops must account for the whole fall.
12. Your turn: 20 words, with 16 recalled at day 0 and 10 at day 1. How big was the first drop, in percentage points?
Subtract the later count from the earlier one.
16 − 10 = 6 words
A drop is earlier minus later.
Your turn: work this step out. Its working is at the end of the packet.
Turn the drop into percentage points.
13. Guided practice
A fictional practice record: 20 words studied once, then written back straight after studying (18 words), one day later (10), two days later (8) and one week later (4). Four readings of this record. Sort each: do the numbers support it?
The numbers support this
The numbers do not support this
Most of the words were lost in the first day, and the loss slowed a lot after that
The person has a poor memory, since so much went in a day
By the end of the next week every word will be gone
Studying the list again would be pointless, as it will only be forgotten again
14. Guided practice
A fictional record in Ebbinghaus's style. A list took 50 minutes to learn the first time and 35 minutes to relearn a week later. Complete the worked savings calculation.
Subtract the relearning time from the first learning time.
50 − 35 = d minutes saved
The saving is the part of the work that did not need doing again.
Divide the saving by the first learning time and multiply by 100.
d ÷ 50 × 100 = s percent
Savings is always a share of the first learning time.
Read what the number means.
Nearly a third of the first effort was not needed again
A list that cannot be recalled can still be relearned faster.
15. Guided practice
A fictional practice record: 20 words studied once, then written back straight after studying (16 words), one day later (8), two days later (6) and one week later (4). Plot the four checks: days since studying along the bottom, words recalled up the side.
Plot your answer on the grid:
16. Practice
A fictional practice record of 20 studied words. Fill in the percentage recalled at each check.
Words recalled, of 20
Percent recalled
Straight after studying
16
One day later
8
Two days later
4
One week later
2
17. Practice
A fictional relearning record. Learning a list of 15 new words by heart took 50 minutes. A month later, none would come back cold, but relearning the list took 30 minutes. What were the savings, as a percentage?
Savings: n percent
18. Somewhere new
A language app reports the share of a word set a learner answered correctly when the set came back: 90 percent after one hour, 66 percent after one day, 50 percent after three days and 46 percent after ten days. After how many days was the share first below half?
The share first fell below half at the check made after n days.
19. Lesson test
Lesson test: one question per skill, one attempt each, no hints. Your answers are checked when you submit.
20. Test question
A fictional practice record: 20 words studied once, then written back straight after studying (16 words), one day later (8), two days later (4) and one week later (2). How many words were lost in the first day, and how many in the six days after that?
The record lost x words in the first day, and y words in the six days after that.
21. What you can do now
Without looking back: describe the shape of a forgetting curve in two words for the start and two for the tail, and say what savings measures. Next: why the gap before a check matters. A trial here is practice, not a test of your memory. What is kept is the list you wrote back on this device today, and it is never set beside anyone else's. You can stop at any point: closing the page is the whole of stopping, and the lesson reopens where you left it.
Working for the steps left to you
12. Your turn: 20 words, with 16 recalled at day 0 and 10 at day 1. How big was the first drop, in percentage points?, step 2