Back to the on-screen lesson ·
Turning a column of readings into points, and letting the shape report the journey.
Paper packet. Every task here also exists on screen, where it is checked automatically; answers written on paper are not assessed by Nydus. When you are back at a device, enter your answers there.
You will turn a table of readings into a distance-time graph, plotting one point for each reading with the time along the bottom and the distance up the side, and draw a pause as a flat line rather than as a gap.
You can read a distance and a speed off a graph somebody else drew, and you can work out a distance from a speed and a time. Now the readings come first and the graph comes second, which is the order it happens in real life.
You also know how to read a scale, and a graph's axes are two scales. Placing a point is reading both scales backward: instead of finding the number at a mark, you find the mark for a number.
| Term | What it means |
|---|---|
| Plot | To mark the place where one reading belongs on a graph. |
| Reading | One pair of numbers taken at one moment: the time, and how far from the start. |
| Point | The mark a reading makes on the graph. |
| Origin | The corner where both axes are zero. |
| Table of readings | A list of readings, one row for each moment. |
| Scale | How much each step along an axis is worth. |
| Line of best fit | A line drawn through or near a set of points to show their pattern. |
A set of readings looks like this:
| time (s) | distance (m) |
|---|---|
| 2 | 6 |
| 4 | 12 |
| 6 | 18 |
Each row becomes one point. The time says how far along the bottom to go; the distance says how far up. So the row 2 s, 6 m becomes a point two across and six up.
Plot all the rows, and the shape tells you the story without anybody explaining it. Points that climb in equal steps make a straight line: steady speed. Two points at the same height make a flat stretch: standing still. Points whose steps get bigger make a line that gets steeper: speeding up.
Another way: steps
To plot one reading:
Another way: action
Take a sheet of squared paper. Label the bottom edge time (s) and the side distance (m). Plot the three rows of the table above, and see the straight line appear.
Swapping the axes. The reading 10 s, 30 m is a point at ten across and thirty up. Putting it at thirty across and ten up draws a different journey altogether — and, worse, one that still looks like a reasonable graph, so nothing about the picture warns you. Say the axis names aloud before the first point.
Plotting the gap instead of the moment. If readings are taken every five seconds, the third reading belongs at fifteen seconds, not at three. The row number is not the time.
Both mistakes come from plotting numbers rather than plotting readings. A reading is always a pair, and it always goes in the same order: time, then distance.
Before you plot anything, decide how much each step along each axis is worth. Look at the biggest number you need to fit. If the readings go up to $18$ m, you might count up the side in twos: $0, 2, 4, \dots, 20$. If they go up to $80$ m, count in tens.
A good scale does three things. It fits every reading on the paper. It uses most of the space, so the points are not squashed into one corner. And it goes up in easy steps like 1, 2, 5 or 10, so that finding a number is quick. A scale that goes up in sevens fits the paper but makes every point a puzzle.
The two axes can have different scales. Time might go up in fives and distance in tens. That is fine, as long as each axis goes up in equal steps all the way along.
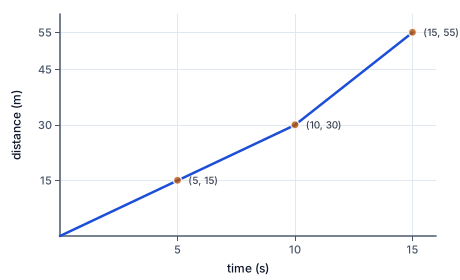
The figure plots the cart's table: three points on a straight line at 3 m/s, then a steeper step to 55 m once the cart speeds up.
Often you are not given the readings; you are given a speed and asked to plot the journey. Then build the table first. For a cart at $3$ m/s:
| time (s) | distance (m) |
|---|---|
| 0 | 0 |
| 5 | 15 |
| 10 | 30 |
| 15 | 45 |
Each row is the speed times that row's time. The column of distances goes up by the same step, $15$ m, every five seconds, which is why the points will lie on a straight line.
If the speed changes partway through, the table changes too. Say the cart speeds up to $5$ m/s after $10$ s. At $15$ s it is not $5 \times 15$ m from the start; it is the $30$ m it had already gone, plus $5 \times 5 = 25$ m more, which is $55$ m. Carry the distance forward; never start again from zero.
Once every reading is plotted, join the points in time order, from left to right, with straight lines. That turns a set of dots into a picture of the journey.
Do not join points out of order, and never join back to the left. The line follows time, and time only goes forward. If two readings have the same time, something has gone wrong with the table, because nothing can be in two places at the same moment.
When real measurements wobble a little, scientists sometimes draw one smooth line of best fit through the middle of the points instead of joining every one. You will do that in later courses. For now, joining each point to the next is the clearest way to see where a journey sped up, slowed down or stopped.
Before you hand a graph in, check four things.
The spot check catches swapped axes, because a swapped point reads back as the wrong pair. The story check catches a wrong number in the table, because it makes a bump that the journey never had.
Nothing about plotting belongs only to journeys. Any time you measure one thing at several moments, you can plot it the same way: time along the bottom, the measurement up the side, one point per reading.
A student might measure the height of a bean plant every day for a week, or the temperature of a cup of hot cocoa every two minutes as it cools. The table has the same two columns, and the graph is built the same way. The shape tells the story again: a plant that grows the same amount each day makes a straight climbing line, and cocoa that cools quickly at first and slowly later makes a line that starts steep and flattens out.
Scientists plot nearly everything they measure, because a graph shows a pattern that a column of numbers hides. Learning to plot a journey carefully is learning a tool you will use in every science course after this one.
For a science fair, a student races a toy car down a hallway and marks where it is every $2$ seconds with a piece of tape. Then she measures from the start line to each piece of tape: $0$ m at $0$ s, $3$ m at $2$ s, $6$ m at $4$ s, $9$ m at $6$ s, and $9$ m at $8$ s.
She plots the five readings with time along the bottom in twos and distance up the side in ones. The first four points lie on a straight line, climbing $3$ m every $2$ s, a steady speed of $3 \div 2 = 1.5$ m/s. The last point is level with the one before: the car stopped, because it hit the wall at the end of the hallway.
Her poster shows the table and the graph side by side. The judges can see the story at a glance, which is exactly why scientists turn tables of readings into graphs.
When a hurricane forms in the Atlantic Ocean, scientists at the National Hurricane Center in Miami record where its center is every few hours. From those readings they plot how far the storm has traveled against time.
Suppose the storm is $0$ km from a starting point at noon, $60$ km away at $3$ p.m., $120$ km at $6$ p.m., and $120$ km again at $9$ p.m. The first three points climb in equal steps, so the storm was moving at a steady $60 \div 3 = 20$ km/h. The last point is level: the storm stalled.
A stalled hurricane is dangerous, because it keeps dropping rain on the same place. Forecasters spot the flat stretch on the graph and warn people in its path to prepare for flooding. The graph turns a table of positions into a picture that anyone can read.
When something stops, learners often leave a gap in the graph, or draw the line coming back down, or draw it going straight up.
All three come from forgetting that the bottom axis is time, and time carries on whatever the object does. During a one-minute stop, the line has to travel a minute's worth to the right — it cannot leave a gap, because the walker was somewhere for every second of it. And the distance from the start did not change, so it cannot go up or down either.
Right and not up is flat. A line that goes straight up would mean covering ground in no time at all, which is the opposite of stopping, and a line coming down would mean walking back toward the start.
A second mistake is starting again from zero after a change of speed. If a cart has gone $30$ m by ten seconds and then speeds up, its next reading is $30$ m plus whatever it adds, never the new speed times the new time alone. Drawing it from zero would make the cart jump backward to the start line in an instant, which no cart can do.
Say the two axis names.
$\text{time (s) along, distance (m) up}$
Before the first point goes down.
Plot the first reading.
$(2, 6)$
Two across, six up.
Plot the second reading.
$(4, 12)$
Four across, twelve up.
Plot the third reading.
$(6, 18)$
Six across, eighteen up.
Read the shape.
$\text{a straight climbing line}$
The picture reports a steady speed without being told.
Read the table.
$(0,0), \ (10,30), \ (20,30), \ (30,50)$
Four readings, one of which repeats a distance.
Plot the first two readings.
$(0,0) \text{ and } (10,30)$
The start and the end of the first walk.
Plot the repeating reading.
$(20, 30)$
Same height as the one before, ten seconds later.
Plot the last reading.
$(30, 50)$
Climbing again.
Join them in time order.
$\text{climb, flat, climb}$
Joining the two level points gives the flat stretch.
Read the story.
$\text{walk, wait, walk}$
Two points, one pause.
Read the speeds and times.
$3\ \text{m/s for } 10\ \text{s, then } 5\ \text{m/s for } 10\ \text{s}$
Build the table before the graph.
Fill the first rows.
$5\ \text{s: } 15\ \text{m}, \quad 10\ \text{s: } 30\ \text{m}$
Speed times time for the slow part.
Carry the distance forward.
$15\ \text{s: } 30 + 5 \times 5 = 55\ \text{m}$
After the change it does not start from zero.
Fill the last row.
$20\ \text{s: } 30 + 5 \times 10 = 80\ \text{m}$
Ten seconds of the faster part added on.
Choose the scales.
$\text{time in fives, distance in tens}$
Up to 20 s and 80 m, in easy steps.
Plot and join the points.
$(0,0), (5,15), (10,30), (15,55), (20,80)$
One point per row, joined in time order.
Read the shape.
$\text{steeper after } 10\ \text{s}$
Bigger steps after the change: faster.
Say the two axis names.
$\text{time along, distance up}$
Time first.
Find the time along the bottom.
Count up to the distance.
You are drawing a graph of a walk, and for one minute the walker stood still. What does that minute look like on the graph?
Complete the worked solution: a scooter rides at $3$ m/s for $10$ s, stops for $10$ s, then rides at $7$ m/s for $10$ s. Find the readings at $10$ s, $20$ s and $30$ s.
Find the reading at ten seconds.
$3 \times 10 =$ p m
Speed times time for the first part.
Find the reading at twenty seconds.
$\text{unchanged: }$ q m
Standing still keeps the same distance: a flat piece.
Find the reading at thirty seconds.
$\text{that} + 7 \times 10 =$ s m
Carry the distance forward and add the last part.
Before plotting, work out the reading. A cart moves at a steady $4$ m/s. How far from the start is it after $5$ s?
Answer: unit: m / cm / km / mm
A cart moves at a steady $5$ m/s. Mark on the time axis the moment it is $60$ m from the start.
0 |——————————| 20
Mark the position with a cross, then write the value:
A cart moves at a steady $3$ m/s. Fill in how far it has gone at each of these times, before you plot anything.
| time (s) | distance from the start (m) | |
|---|---|---|
| after 5 s | 5 | |
| after 10 s | 10 | |
| after 15 s | 15 | |
| after 20 s | 20 |
A cart rolls steadily down a hallway. After $2$ s it has gone $2$ m, after $4$ s it has gone $4$ m, and after $6$ s it has gone $6$ m. Plot those three readings.
Plot your answer on the grid:
Dara is skating along the path, stopping to look at a bird, then skating on. The readings are: $0$ m at $0$ s, $50$ m at $10$ s, $50$ m at $20$ s, $80$ m at $30$ s. Plot all four.
Plot your answer on the grid:
A cart rolls at a steady $3$ m/s for the first $10$ s, then is pushed and rolls at a steady $7$ m/s for the next $10$ s. Fill in how far from the start it is at each time, ready to plot.
| time (s) | distance from the start (m) | |
|---|---|---|
| after 5 s | 5 | |
| after 10 s | 10 | |
| after 15 s | 15 | |
| after 20 s | 20 |
A snail is timed crossing a square of sidewalk. At $5$ min it had gone $4$ cm; at $10$ min, $8$ cm; at $15$ min it had not moved since the last reading. Plot the three readings.
Plot your answer on the grid:
Lesson test: one question per skill, one attempt each, no hints. Your answers are checked when you submit.
A cart moves at a steady $4$ m/s. Fill in how far it has gone at each of these times, before you plot anything.
| time (s) | distance from the start (m) | |
|---|---|---|
| after 5 s | 5 | |
| after 10 s | 10 | |
| after 15 s | 15 | |
| after 20 s | 20 |
You can plot a set of readings as a graph. Tell someone why a pause is drawn as a flat line and never as a gap.
17. Your turn: the reading is 15 s and 45 m. Where does the point go?, step 2
$15 \text{ across}$
Fifteen seconds.
17. Your turn: the reading is 15 s and 45 m. Where does the point go?, step 3
$45 \text{ up: the point } (15, 45)$
Mark where they meet.