Back to the on-screen lesson ·
What a climbing line, a flat line and a steeper line each say about a journey.
Paper packet. Every task here also exists on screen, where it is checked automatically; answers written on paper are not assessed by Nydus. When you are back at a device, enter your answers there.
You will read a distance-time graph: say how far from the start something was at any moment, say when it was standing still, and work out the speed of any straight piece from the distance it gained and the time it took.
You can work out a speed by dividing a distance by a time, and from Grade 3 you can read a value off a scale. A graph has two scales at once, one along the bottom and one up the side, and reading it is reading both of them.
You have also seen graphs before: bar graphs of favorite fruits, line graphs of the temperature through a week. A distance-time graph is a line graph like those, with time along the bottom. What is new is what its steepness means.
| Term | What it means |
|---|---|
| Axis | An edge of the graph with a scale on it. A graph has two axes. |
| Distance-time graph | A graph with time along the bottom and distance from the start up the side. |
| Point | A place on the graph that shows one moment: a time and a distance. |
| Piece | A straight part of the line between two points. |
| Steep | Climbing a lot in a little time: moving fast. |
| Flat | Not climbing at all: standing still. |
| Gain | How much the distance went up across a piece. |
A distance-time graph is not a drawing of where somebody went. It is a record of how far from the start they were at each moment.
That gives three readings, and no others:
And the speed of any straight piece is the distance it gained divided by the time it took. From $(0,0)$ up to $(10\text{ s}, 30\text{ m})$ is $30 \div 10 = 3$ m/s.
A point on the graph is written as two numbers in brackets, time first: $(10, 30)$ means at $10$ s the walker was $30$ m from the start.
Another way: steps
To read a speed off a piece of the line:
Another way: action
Walk slowly across a room, stop for a few seconds, then walk fast. Now draw what the graph of your walk would look like: gently climbing, flat, then steeply climbing.
For a piece that does not start at the bottom of the graph, the number to use is how much it went up, not how high it ends.
Take a line that is flat at 30 m until 20 s, then climbs to 50 m by 30 s. The last piece gained $50 - 30 = 20$ m, and it took $30 - 20 = 10$ s, so the speed is $20 \div 10 = 2$ m/s.
Using 50 and 30 straight off the axes would give $50 \div 30$, which is not the speed of anything. It mixes up where it had got to with how far it went in this piece — and the whole journey's average is a third thing again. Subtract both pairs first, then divide once.
You can often tell which piece is faster without any arithmetic. Put your finger on the start of each piece and slide it along one second. Whichever line lifted your finger higher gained more distance in that second, so it is the faster piece.
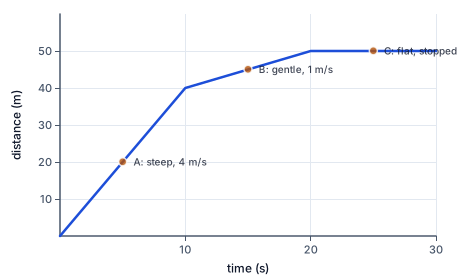
| Piece | Gain | Time | Speed | Looks |
|---|---|---|---|---|
| A | 40 m | 10 s | 4 m/s | steep |
| B | 10 m | 10 s | 1 m/s | gentle |
| C | 0 m | 10 s | 0 m/s | flat |
Steep, gentle and flat line up with fast, slow and stopped. That is the whole picture-reading of a distance-time graph. The arithmetic puts exact numbers on what the steepness already shows.
The figure is a journey in three pieces: steep for 4 m/s, gentle for 1 m/s, and flat where the walker stops.
A graph with several pieces tells a story from left to right. Read it one piece at a time, and for each piece say three things: when it starts and ends, how much distance it gains, and what that means.
For example: from $0$ to $10$ s the line climbs to $30$ m, so the walker moves at $3$ m/s. From $10$ to $20$ s it stays at $30$ m, so the walker stands still, perhaps waiting at a crosswalk. From $20$ to $30$ s it climbs to $50$ m, so the walker moves on at $2$ m/s, a little slower than before.
The whole journey is $50$ m in $30$ s. Dividing gives the average speed for the trip, about $1.7$ m/s. That average is slower than either moving piece, because it includes the ten seconds standing still.
Three checks catch most mistakes.
The third check is the one that works without any numbers at all, and it is worth doing first, before you divide anything.
Some graphs have a piece that slopes down from left to right. Up the side is distance from the start, so a line going down means that distance is getting smaller: the walker is coming back toward the start.
Picture a child who walks $40$ m to a mailbox in $20$ s, stands there for $10$ s, and walks back home in $20$ s. The graph climbs to $40$ m, stays flat, then slopes back down to $0$ m at $50$ s. The last piece lost $40$ m in $20$ s, so the child walked back at $40 \div 20 = 2$ m/s, the same speed as on the way out.
A line sloping down is still read left to right, because time still only goes forward. It does not mean going downhill, and it does not mean going back in time. It means getting closer to where you started. A line that returns all the way to zero means the walker is back at the start.
Scientists rarely draw a distance-time graph by hand. They use a motion sensor, a small box that sends out pulses of sound too high for people to hear. The pulses bounce off a moving object and come back, and the sensor measures how long the echo took. From that it works out how far away the object is, many times each second.
A computer plots each measurement as a point: the time along the bottom, the distance up the side. Join the points and you have the graph. In a classroom, a student can walk toward and away from a motion sensor and watch their own graph appear on the screen as they move. Walking fast makes a steep line, standing still makes a flat one, and walking back toward the sensor makes the line slope down.
Traffic engineers, sports scientists and the people who design roller coasters all read graphs made this way.
Many American cities have apps that track buses. Behind the map, the app keeps a record of how far along its route each bus is at each moment, which is a distance-time graph.
Suppose the graph for one bus climbs from $0$ m to $1200$ m in the first $120$ s. That piece has a speed of $1200 \div 120 = 10$ m/s. Then the line is flat for $60$ s while the bus waits at a stop to let people on. Then it climbs from $1200$ m to $1800$ m in the next $100$ s, a speed of $600 \div 100 = 6$ m/s, slower because of traffic.
The app reads these pieces to predict when the bus will reach you. A flat piece that goes on too long tells the app the bus is stuck, and it updates the arrival time. The app is doing exactly what you did in this lesson: reading gains and times off a graph and dividing.
A runner wears a watch that records her distance every second. After the run, the watch app draws a distance-time graph. For the first $600$ s it climbs steadily to $1800$ m, so she ran at $1800 \div 600 = 3$ m/s. Then there is a flat piece of $120$ s: she stopped to drink water. Then it climbs from $1800$ m to $3000$ m in $400$ s, which is $1200 \div 400 = 3$ m/s again.
The two moving pieces have the same steepness, so she ran both at the same speed. Her whole run was $3000$ m in $1120$ s, an average of about $2.7$ m/s, because the water break counts in the total time.
Coaches read these graphs to see whether a runner slowed down near the end. A last piece gentler than the first means she tired; a steeper one means she finished with a sprint.
The single biggest trap is seeing the line as the shape of the ground. A steep part looks like a hill, so it gets read as climbing a hill; a flat part looks like a level road, so it gets read as walking along the flat.
But there is no ground anywhere on this graph. The side of it measures distance from the start, and the bottom measures time. A flat line therefore says the distance stopped changing — the walker stood still, perhaps at a crosswalk, perhaps to tie a shoelace.
One more thing follows from the axes: the line can never go back to the left, because time does not. If you find yourself reading a graph right-to-left, something has gone wrong.
A last slip is dividing the height at the end of a piece by the time at its end. That gives the average speed from the very start, not the speed of the piece. For any piece that does not begin at the bottom-left corner, subtract first.
Find the ends of the piece.
$(0, 0) \text{ and } (10, 30)$
Time first, then distance.
Find the distance gained.
$30 - 0 = 30\ \text{m}$
Subtract the distances at the two ends.
Find the time taken.
$10 - 0 = 10\ \text{s}$
Subtract the times at the two ends.
Divide the gain by the time.
$30 \div 10 = 3\ \text{m/s}$
Steepness is speed.
Check against the look.
$\text{climbing, so moving}$
A climbing piece must give a speed above zero.
Find the ends of the piece.
$(10, 30) \text{ and } (20, 30)$
This piece starts partway up.
Find the distance gained.
$30 - 30 = 0\ \text{m}$
The distance did not change.
Find the time taken.
$20 - 10 = 10\ \text{s}$
Ten seconds went by.
Divide the gain by the time.
$0 \div 10 = 0\ \text{m/s}$
No distance in ten seconds.
Say what it means.
$\text{standing still}$
Flat means stopped, not walking on level ground.
Check against the look.
$\text{flat, so zero}$
The picture and the number agree.
List the pieces.
$(0,0) \to (10,30) \to (20,30) \to (30,50)$
Three straight pieces, read left to right.
Work out the first piece.
$30 \div 10 = 3\ \text{m/s}$
30 m gained in 10 s.
Work out the middle piece.
$0 \div 10 = 0\ \text{m/s}$
Flat: waiting at a crosswalk.
Find the last piece's gain.
$50 - 30 = 20\ \text{m}$
Use the gain, not the height.
Work out the last piece.
$20 \div 10 = 2\ \text{m/s}$
Slower than the first piece.
Compare with the look.
$\text{first steeper than last}$
3 m/s is steeper than 2 m/s, as the graph shows.
Find the average for the trip.
$50 \div 30 \approx 1.7\ \text{m/s}$
Slower than either moving piece, because it includes the wait.
Find the distance gained.
$50 - 30 = 20\ \text{m}$
Gain first.
Find the time taken.
Divide the gain by the time.
On Cai's graph the line is flat from $10$ s to $20$ s, sitting at $20$ m the whole time. What was happening?
Complete the worked solution: a graph climbs straight from $0$ m at $0$ s to $20$ m at $10$ s, stays flat until $20$ s, then climbs straight to $100$ m at $30$ s. Find the speed of each moving piece.
Find the first piece's speed.
$20 \div 10 =$ p m/s
It gained that many meters in ten seconds.
Find the last piece's gain.
$100 - 20 =$ g m
Use the gain, not the final height.
Find the last piece's speed.
$\text{gain} \div 10 =$ q m/s
The last piece also lasted ten seconds.
Dara's graph has three straight pieces. Match each piece to what it says.
| moving at $5$ m/s | standing still | moving at $3$ m/s | |
|---|---|---|---|
| the piece from $0$ s to $10$ s | |||
| the piece from $10$ s to $20$ s | |||
| the piece from $20$ s to $30$ s |
Put these four moments from Cai's graph in the order they happen.
Number the steps in order (write the number in the box):
Dara's graph climbs straight from $0$ m at $0$ s to $50$ m at $10$ s, stays at $50$ m until $20$ s, then climbs straight to $80$ m at $30$ s. For each piece, fill in the distance gained, the time taken and the speed.
| distance gained (m) | time taken (s) | speed (m/s) | |
|---|---|---|---|
| first piece | |||
| middle piece | |||
| last piece |
Cai is cycling slowly uphill, resting at the top, then rolling down. The graph climbs straight from $0$ m at $0$ s to $20$ m at $10$ s, then stays flat, then climbs again to $70$ m at $30$ s. How fast was Cai going over the first $10$ seconds?
Up to (10 s, 20 m), flat to 20 s, up to (30 s, 70 m).
the speed over the first part, in meters per second:
Cai's graph is flat between $10$ s and $20$ s. How far from the start was Cai at $20$ s?
Answer: unit: m / cm / km / mm
The same graph: flat at $20$ m until $20$ s, then climbing straight to $70$ m at $30$ s. How fast was Cai going over that last part?
Flat at 20 m to 20 s, then up to (30 s, 70 m).
the speed over the last part, in meters per second:
A ferry is already $8$ km out when the clock starts, and it moves steadily away from the harbor. After $4$ hours it is $24$ km out. Give how many kilometers it covers each hour, and how far out it was when the clock started.
A straight line from (0 h, 8 km) to (4 h, 24 km).
kilometers covered each hour:
kilometers from the harbor when the clock started:
Lesson test: one question per skill, one attempt each, no hints. Your answers are checked when you submit.
Bo's graph climbs straight from $0$ m at $0$ s to $40$ m at $10$ s, stays at $40$ m until $20$ s, then climbs straight to $50$ m at $30$ s. For each piece, fill in the distance gained, the time taken and the speed.
| distance gained (m) | time taken (s) | speed (m/s) | |
|---|---|---|---|
| first piece | |||
| middle piece | |||
| last piece |
You can read a distance and a speed off a distance-time graph. Tell someone why a flat line means standing still rather than walking on level ground.
17. Your turn: from (20 s, 30 m) to (30 s, 50 m). How fast?, step 2
$30 - 20 = 10\ \text{s}$
Then the time it took.
17. Your turn: from (20 s, 30 m) to (30 s, 50 m). How fast?, step 3
$20 \div 10 = 2\ \text{m/s}$
The speed of that piece.