Back to the on-screen lesson ·
Work as the area under a PV path; isobaric, isochoric, isothermal and adiabatic processes; and the net work of a cycle.
Paper packet. Every task here also exists on screen, where it is checked automatically; answers written on paper are not assessed by Nydus. When you are back at a device, enter your answers there.
By the end of this lesson you will be able to read work from a PV diagram for any standard process and for a full cycle.
From the last lesson you know the first law, $\Delta U = Q + W$, and that a gas expanding at constant pressure does work $P\Delta V$. From Physics 1 you know that the area under a graph can represent a physical quantity, as displacement is the area under a velocity graph. This lesson reads work as an area on a pressure-volume diagram.
| Term | What it means |
|---|---|
| PV diagram | A graph of pressure against volume; each point is a state of the gas. |
| Isobaric | At constant pressure: a horizontal line. |
| Isochoric | At constant volume: a vertical line, with no work done. |
| Isothermal | At constant temperature: a hyperbola, $PV$ constant. |
| Adiabatic | With no heat flow: a curve steeper than an isotherm. |
| Cycle | A process that returns the gas to its starting state. |
Plot a gas's pressure against its volume and every state is a point; every process is a path from one point to another. Because the work done by the gas over a small volume change is $P\,dV$, the total work is the area under the path:
$$W_{\text{by}} = \text{area under the } P\text{–}V \text{ curve}.$$
Expanding to the right, the gas does positive work; compressed to the left, it does negative work. Around a closed cycle, the gas returns to its start, so $\Delta U = 0$, and the net work equals the area enclosed, positive for a clockwise loop. The four standard processes each have a signature shape.
Another way: picture
Picture pushing a stalled car along a road while a friend records how hard you push at each point. The work you do is the area under the force-distance graph. A PV diagram is the same record for a gas pushing a piston: pressure times area is the force, and volume divided by area is the distance.
Another way: steps
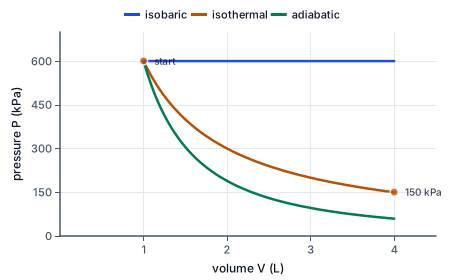
The chart starts a gas at $1$ L and $600$ kPa and expands it to $4$ L in three ways. The isobaric expansion keeps the pressure at $600$ kPa, so its path is flat and the area under it, the work, is largest: $1800$ J. Heat must flow in to keep the pressure up as the gas expands.
The isothermal expansion follows the hyperbola $PV = 600$ kPa·L, and its work is smaller: $600 \ln 4 \approx 832$ J. The adiabatic expansion falls more steeply, because the gas cools as it expands with no heat coming in, and does the least work of all. Same start, same final volume, three different amounts of work: work depends on the path.
In a rigid container, the volume cannot change, so the path is a vertical line with no area beneath it, and no work is done. Any heat added goes entirely into internal energy: $\Delta U = Q$. That is how a pressure cooker works; the sealed pot's pressure rises as it is heated.
At constant pressure, as in a cylinder under a freely sliding weighted piston, the path is horizontal, and the work is $P\Delta V$. Heating the gas makes it expand, doing work on the piston, so only part of the heat stays as internal energy.
An isothermal process keeps the temperature fixed, so $PV = nRT$ is constant and the path is a hyperbola. The work, the area under a hyperbola, is $nRT\ln(V_2/V_1)$. Since $\Delta U = 0$, the heat absorbed exactly equals the work done: energy passes straight through.
An adiabatic process allows no heat flow. An expanding gas then pays for its work out of internal energy and cools, so its pressure falls faster than an isotherm's. For a monatomic gas, $PV^{5/3}$ stays constant. Real processes are adiabatic when they are fast, like the compression stroke of an engine or a sound wave.
An engine takes a gas around a cycle again and again. On each trip the gas ends in its starting state, so $\Delta U = 0$ and, by the first law, the net heat absorbed equals the net work done. That work is the enclosed area.
For the area to be positive, the gas must expand at high pressure and be compressed at low pressure: a clockwise loop. That requires heating the gas before the expansion and cooling it before the compression. Run the loop counterclockwise and the net work is negative: work must be supplied, as in a refrigerator.
Checking an answer. A vertical path must give zero work. An isothermal path must give $Q = W$. A clockwise cycle must give positive net work, and the net work can never exceed the work of the expansion legs alone.
The work done by a gas on a piston of area $A$ moving a distance $dx$ is $F\,dx = PA\,dx = P\,dV$. Adding these contributions over the whole process gives the area under the curve. That requires the process to be slow enough that the gas has a single, well-defined pressure at each moment, which is what the smooth path on the diagram represents.
The isothermal formula comes from integrating $P = nRT/V$, which gives a logarithm. The cycle rule follows from internal energy being a state function: any path that returns to its starting point has $\Delta U = 0$.
A car engine runs an approximately closed cycle called the Otto cycle, after Nikolaus Otto's 1876 engine. The piston compresses the fuel-air mixture adiabatically, a spark ignites it at nearly constant volume, the hot gas expands adiabatically pushing the piston down, and the exhaust valve releases pressure at constant volume.
On a PV diagram this is a loop bounded by two adiabats and two vertical lines. The enclosed area, a few hundred joules per cylinder per cycle in a family car, multiplied by how many cycles happen each second, gives the engine's power. Engine designers still measure these diagrams with pressure sensors in the cylinder.
Take a gas from one state to another by two different paths and it does different amounts of work, as the chart shows. Because the internal energy change is the same on both paths, the heat absorbed must differ by exactly the same amount as the work. Heat and work both depend on the path; their difference, $\Delta U$, does not.
This is why a PV diagram is so useful. It shows at a glance which path does more work, and hence, with the first law, which needs more heat. Engineers choose paths to get the most work from the least fuel.
The PV diagram was invented by James Watt's assistant John Southern around 1796 to improve steam engines. A pencil attached to a small piston connected to the cylinder traced pressure as a card moved with the main piston, drawing the loop directly. The device, called an indicator, let engineers see the work of each stroke and find wasted energy.
American railroads used indicator cards well into the twentieth century to tune locomotives, and the power they measured, called indicated horsepower, is still quoted for large marine diesel engines today.
Run a cycle backward, counterclockwise, and the gas is compressed at high pressure and expands at low pressure. The net work done by the gas is negative: the surroundings must do work on it. In return, the gas absorbs heat at low temperature and releases more heat at high temperature.
That is a refrigerator or heat pump. The enclosed area is the electrical work the compressor supplies each cycle. The lessons on entropy and heat engines explain why some work is always needed to move heat from cold to hot, and how little of it the best machines require.
A typical American family car's four-cylinder engine displaces about $2.5$ L. Pressure sensors in the cylinders show a loop on the PV diagram enclosing roughly $500$ J per cylinder per cycle at full throttle. Because a four-stroke engine fires each cylinder once every two revolutions, at $3000$ rpm each cylinder completes $25$ cycles per second.
Four cylinders times $25$ cycles times $500$ J gives $50$ kW, about $67$ horsepower at that speed, rising at higher rpm. Engineers raise the loop's area with turbochargers, which push more air into the cylinder, raising the pressure throughout the cycle. That is how small modern engines match the power of larger old ones.
A pressure cooker is a sealed pot whose lid locks, so the steam and air inside are heated at constant volume. With no work possible, all the heat raises the internal energy, and the pressure climbs until a weighted valve lets steam escape at about $100$ kPa above atmospheric.
At that pressure water boils at about $120$ °C instead of $100$ °C, cooking beans and tough cuts of meat in a third of the time. Electric pressure cookers, now in millions of American kitchens, measure the pressure electronically and hold it steady. Their safety valves exist because a constant-volume process can build pressure without limit if heating continues.
A common mistake is to think that because a gas returns to its starting state after a cycle, it has done no work. Its internal energy is unchanged, but the work done while expanding at high pressure is larger than the work done on it while being compressed at low pressure. The difference is the enclosed area, and it is the useful output of every engine.
A related error is to think work depends only on the starting and ending states. It depends on the path: the same two states joined by different paths enclose different areas beneath them.
A gas goes from $200$ kPa, $2$ L to $100$ kPa, $6$ L by path A: first expand at $200$ kPa, then cool at constant volume. Find the work on the first leg.
$W_1 = 200 \times (6 - 2) = 800\ \text{J}$
Isobaric expansion.
Find the work on the second leg of path A.
$W_2 = 0$
Constant volume.
Total path A.
$W_A = 800\ \text{J}$
Sum of legs.
Path B: first cool at $2$ L to $100$ kPa, then expand at $100$ kPa. Find its work.
$W_B = 0 + 100 \times 4 = 400\ \text{J}$
Only the flat leg counts.
Compare the heats, since $\Delta U$ is the same.
$Q_A - Q_B = W_A - W_B = 400\ \text{J}$
Path A needs more heat.
$0.50$ mol of gas at $300$ K is compressed slowly from $10$ L to $4$ L. Find the volume ratio.
$\dfrac{V_2}{V_1} = \dfrac{4}{10} = 0.4$
Final over initial.
Take its logarithm.
$\ln 0.4 = -0.916$
Negative for compression.
Find the work done by the gas.
$W_{\text{by}} = 0.50 \times 8.314 \times 300 \times (-0.916) = -1142\ \text{J}$
Area under the hyperbola, leftward.
State the internal energy change.
$\Delta U = 0$
Constant temperature.
Find the heat.
$Q = W_{\text{by}} = -1142\ \text{J}$
The gas releases heat.
Find the final pressure.
$P_2 = \dfrac{0.50 \times 8.314 \times 300}{4} = 312\ \text{kPa}$
From $PV = nRT$.
A gas goes from A ($100$ kPa, $2$ L) to B ($100$ kPa, $6$ L) to C ($300$ kPa, $2$ L) and back to A. Find the work from A to B.
$W_{AB} = 100 \times 4 = 400\ \text{J}$
Isobaric expansion.
Find the work from B to C along the straight line.
$W_{BC} = -\dfrac{100 + 300}{2} \times 4 = -800\ \text{J}$
Compression under a trapezoid.
Find the work from C to A.
$W_{CA} = 0$
Constant volume.
Add for the net work.
$W_{\text{net}} = 400 - 800 = -400\ \text{J}$
Negative: a counterclockwise loop.
Check with the triangle's area.
$\tfrac{1}{2} \times 4 \times 200 = 400\ \text{J}$
The enclosed area, signed by direction.
Find the net heat for the cycle.
$Q_{\text{net}} = W_{\text{net}} = -400\ \text{J}$
The gas gives out net heat.
Identify the process.
$\text{isobaric: a flat line}$
Constant pressure.
Find the volume change.
$\Delta V = 5 - 2 = 3\ \text{L}$
Final minus initial.
Find the work.
A gas is taken clockwise around a rectangle on a PV diagram, between pressures of $100$ kPa and $300$ kPa and volumes of $2$ L and $6$ L. How much net work does it do in one cycle?
Complete the worked solution: a gas runs clockwise around a rectangle on a PV diagram, expanding by $5$ L at $500$ kPa and being compressed by the same amount at $200$ kPa, with vertical legs between. Find the work done by the gas on the top leg, on the bottom leg, and in the whole cycle, in J.
Find the work on the high-pressure expansion.
$W_{\text{top}} = P_{\text{high}}\Delta V =$ t
Positive: the gas expands.
Find the work on the low-pressure compression.
$W_{\text{bottom}} = -P_{\text{low}}\Delta V =$ m
Negative: the gas is compressed.
Add the legs for the net work.
$W_{\text{net}} = W_{\text{top}} + W_{\text{bottom}} =$ n
The enclosed area.
Apply the first law to the cycle.
$\Delta U = 0 \Rightarrow Q_{\text{net}} = W_{\text{net}}$
The gas ends where it began.
Match each path on a PV diagram to the process it shows.
| isobaric | isochoric | isothermal | adiabatic | |
|---|---|---|---|---|
| horizontal line | ||||
| vertical line | ||||
| curve with PV constant | ||||
| curve falling more steeply than PV constant |
$0.50$ mol of an ideal gas expands slowly at a constant $400$ K until its volume is $4$ times larger. With $R = 8.314$ J/(mol·K), fill in the work done by the gas, the heat it absorbs, and its change in internal energy, all in J.
| value | |
|---|---|
| work done by the gas (J) | |
| heat absorbed (J) | |
| change in internal energy (J) |
A gas held at a constant $200$ kPa expands from $3$ L to a volume $V$ in liters. Write the work it does, in J, as a function of $V$.
Answer:
A gas is taken along a straight line on a PV diagram from $80$ kPa at $1$ L to $240$ kPa at $7$ L. How much work does the gas do, in J?
Answer: J
In a four-cylinder, four-stroke car engine, the gas in each cylinder does $400$ J of net work per cycle, the area of its loop on a PV diagram. Each cylinder completes one cycle every two revolutions. At $2400$ revolutions per minute, what power does the engine deliver, in kW?
Answer: kW
Lesson test: one question per skill, one attempt each, no hints. Your answers are checked when you submit.
A gas held at a constant $120$ kPa expands from $4$ L to a volume $V$ in liters. Write the work it does, in J, as a function of $V$.
Answer:
You can read work from a PV diagram. Explain to someone why a gas that returns to its starting state can still have done net work.
21. Your turn: a gas at $300$ kPa expands from $2$ L to $5$ L. How much work does it do?, step 3
$W = 300 \times 3 = 900\ \text{J}$
kPa times L.