Back to the on-screen lesson ·
The slope of a position-time graph is velocity, the slope of a velocity-time graph is acceleration, and the area under a velocity-time graph is displacement.
Paper packet. Every task here also exists on screen, where it is checked automatically; answers written on paper are not assessed by Nydus. When you are back at a device, enter your answers there.
By the end of this lesson you will be able to read velocities and accelerations from the slopes of motion graphs and displacements from their areas.
You can find displacements, velocities and accelerations, each with a sign. You have plotted points on a grid and found the slope of a straight line. This lesson shows how the slope and the area of a motion graph are themselves physical quantities.
| Term | What it means |
|---|---|
| Position-time graph | A graph with time across and position up the side. |
| Velocity-time graph | A graph with time across and velocity up the side. |
| Slope | Rise over run: the change up the side divided by the change across. |
| Rise | The change in the quantity on the vertical axis. |
| Run | The change in time along the horizontal axis. |
| Area under a graph | The region between a velocity-time line and the time axis. |
Motion graphs carry quantities in their shapes:
A straight line means a steady rate; a curve means the rate is changing. A flat line on a position-time graph means standing still; a flat line on a velocity-time graph means moving at a steady velocity.
Another way: picture
Picture a family road trip graphed with time across the bottom and distance from home up the side. Highway driving draws a steep line, a slow drive through town a gentle one, and a stop for lunch a flat stretch. The steepness at any moment tells you how fast the car was going then.
Another way: steps
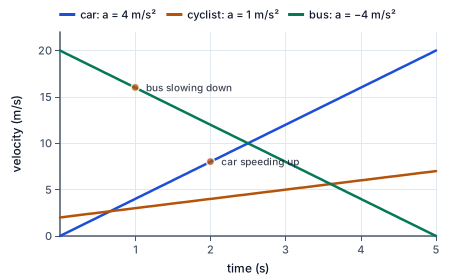
The velocity-time graph shows three vehicles. The car's line rises steeply: its velocity grows by $4$ m/s every second. The cyclist's line rises gently, by $1$ m/s every second. The bus's line falls, losing $4$ m/s every second until it stops.
The slope of each line is its acceleration. The area under each line, down to the time axis, is how far each vehicle traveled. After five seconds the car has covered the area of a triangle, $\tfrac{1}{2} \times 5 \times 20 = 50$ m.
On a position-time graph, the height of the line shows where the object is at each time. A line rising steeply means the object moves quickly away from the origin; a gentle rise, slowly; a flat line, not moving at all; a falling line, moving back toward the origin.
The slope is the velocity. Between two points on a straight line, the rise is the change in position and the run is the change in time, so rise over run is meters per second.
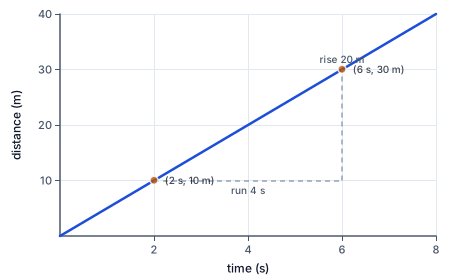
The cyclist's line passes through $10$ m at $2$ s and $30$ m at $6$ s. The rise is $20$ m and the run is $4$ s, so the slope is $5$ m/s, and that is the cyclist's speed at every moment on the line.
On a velocity-time graph, the height shows how fast the object moves at each moment. A flat line means steady velocity; a rising line, speeding up; a falling line, slowing down. A line on the time axis means standing still.
The slope is the acceleration: the change in velocity divided by the change in time, in meters per second squared. A steeper line means a bigger acceleration.
For an object moving at a steady $5$ m/s for $4$ s, the velocity-time graph is a flat line at $5$, and the region under it is a rectangle $4$ wide and $5$ tall. Its area, $20$, is the displacement in meters: velocity times time.
The same idea works for any shape. When the velocity changes steadily, the region is a triangle or a trapezoid, and its area is still the displacement. Area is the tool that turns a changing velocity into a distance.
To find a slope, choose two points far apart on the line, where the grid lines make the values easy to read. Subtract the first position from the second for the rise, and the first time from the second for the run.
Using points far apart reduces reading errors. Always subtract in the same order, later minus earlier, for both rise and run, so the sign of the slope comes out right.
Checking an answer. A slope's unit is the vertical unit per second. An area's unit is the vertical unit times seconds. A steeper line must give a larger slope.
Velocity is the rate of change of position, and slope is exactly a rate of change: how much the vertical quantity changes for each unit across. So the slope of a position graph must be the velocity.
For the area, think of a thin strip under a velocity line. Its height is the velocity and its width a short time, so its area is a short distance. Adding all the strips adds up all the short distances into the total displacement.
When a position-time graph curves upward, its slope is increasing: the object is speeding up. When it curves toward flat, the object is slowing down. The slope at any single moment is the steepness of the curve right there.
For now, straight-line pieces are enough. Many real trips can be broken into straight pieces: speeding up, cruising, slowing down, each with its own steady rate.
A position-time graph that rises is not a picture of a hill. It shows the object getting farther from the origin as time passes. A car driving on flat ground can have a steeply rising position-time graph.
Likewise, a velocity-time graph that crosses below the time axis does not mean the object went underground. It means the velocity became negative: the object turned around and moved the other way.
Coaches use motion graphs to study athletes. A sprinter's velocity-time graph rises steeply in the first few seconds, then levels off at top speed. The area under it over the whole race equals the hundred meters.
Swimmers and cyclists wear sensors that record their position many times a second. The software turns the data into graphs, and the slopes show where an athlete sped up or tired.
Real measurements rarely fall exactly on a straight line. When points scatter a little, draw the straight line that fits them best, with as many points above as below, and find its slope.
This best-fit slope averages out small measuring errors. It is how students in a lab find the velocity of a cart from a table of timed positions.
The most common error is dividing a single point's position by its time. That gives the slope from the origin, which is the velocity only if the line passes through the origin. Use the change between two points.
Another is to read a velocity-time graph as if it were a position-time graph, saying a flat line means standing still. On a velocity-time graph, a flat line above the axis means moving steadily.
Every slope and area carries units from the axes. A position axis in meters and a time axis in seconds give a slope in meters per second. A velocity axis in meters per second and a time axis in seconds give an area in meters.
If a graph uses kilometers and hours, the slope is in kilometers per hour. Checking the units of the answer against the question's units catches many slips.
To draw a motion graph from a table, put time along the bottom with evenly spaced ticks, and the position or velocity up the side. Plot each row as a point, then join the points with straight segments or a smooth best-fit line.
Label both axes with the quantity and its unit. A graph without labels could show anything, and a reader cannot tell a slope from an area without knowing what the axes mean.
A position-time line that falls has a negative slope: the object is moving back toward the origin, in the negative direction. A velocity-time line that falls has a negative slope too, a negative acceleration, which slows an object that is moving forward.
Big-city marathons in Boston, New York and Chicago put timing mats every five kilometers. Each runner's shoe chip records the time at every mat, and the results websites plot a distance-time graph for anyone who wants to follow a friend.
The slope between two splits is the runner's speed over that stretch. A graph that stays straight shows an even pace, the goal of most experienced runners. A line that bends toward flat near the end shows a runner slowing down, often called hitting the wall. Coaches compare the slopes of the first and second halves to judge whether a runner started too fast.
A subway train in New York or Washington, D.C., follows a velocity-time pattern between every pair of stations: it speeds up, cruises, then slows to a stop. Its velocity-time graph looks like a flat-topped hill.
Engineers plan the schedule from the area under that graph, which must equal the distance between stations. The slopes at the start and end are limited so standing passengers can keep their balance, usually to about one meter per second squared. Knowing the allowed slopes and the distance, planners work out how long each trip must take and how many trains the line can run each hour.
It is easy to read a rising position-time line as a hill the object climbed. But the graph shows position against time, not the shape of the ground. A car on a flat highway can draw a steeply rising line just by driving fast.
A related error is to read the height of a velocity-time graph as the position. The height is how fast the object is moving; where it is comes from the area under the line.
A position-time line passes through $100$ m at $20$ s and $400$ m at $220$ s. Find the rise.
$\Delta x = 400 - 100 = 300\ \text{m}$
Change in position.
Find the run.
$\Delta t = 220 - 20 = 200\ \text{s}$
Change in time.
Find the slope.
$v = \dfrac{300}{200} = 1.5\ \text{m/s}$
The walking velocity.
Predict the position at $320$ s.
$x = 400 + 1.5 \times 100 = 550\ \text{m}$
Same slope continues.
Describe a flat part at the end.
$\text{standing still at school}$
Zero slope.
A velocity-time line rises from $4$ m/s at $0$ s to $16$ m/s at $6$ s. Find the slope.
$a = \dfrac{16 - 4}{6} = 2\ \text{m/s}^2$
The acceleration.
Split the area into a rectangle and a triangle.
$\text{rectangle } 6 \times 4, \ \text{triangle } \tfrac{1}{2} \times 6 \times 12$
Easy shapes.
Find the rectangle's area.
$6 \times 4 = 24\ \text{m}$
Steady part.
Find the triangle's area.
$\tfrac{1}{2} \times 6 \times 12 = 36\ \text{m}$
Extra from speeding up.
Add the areas.
$24 + 36 = 60\ \text{m}$
The displacement.
Check with the average velocity.
$\tfrac{1}{2}(4 + 16) \times 6 = 60\ \text{m}$
The same.
A bus speeds up from rest to $12$ m/s in $6$ s, cruises for $20$ s, then slows to rest in $8$ s. Find the first slope.
$a_1 = \dfrac{12}{6} = 2\ \text{m/s}^2$
Speeding up.
Find the last slope.
$a_3 = \dfrac{0 - 12}{8} = -1.5\ \text{m/s}^2$
Slowing down.
Find the first area.
$\tfrac{1}{2} \times 6 \times 12 = 36\ \text{m}$
A triangle.
Find the middle area.
$20 \times 12 = 240\ \text{m}$
A rectangle.
Find the last area.
$\tfrac{1}{2} \times 8 \times 12 = 48\ \text{m}$
A triangle.
Add the areas.
$36 + 240 + 48 = 324\ \text{m}$
Distance between stops.
Find the average velocity.
$\dfrac{324}{34} = 9.5\ \text{m/s}$
Over the whole trip.
Find the rise and the run.
$\Delta x = 30\ \text{m}, \ \Delta t = 5\ \text{s}$
Changes between the points.
Divide rise by run.
$v = \dfrac{30}{5}$
The slope.
Evaluate the velocity.
A straight line on a position-time graph passes through $10$ m at $0$ s and $40$ m at $6$ s. What velocity does it show, in m/s?
Complete the worked solution: a walker's position-time graph is a straight line through $2$ m at $1$ s and $14$ m at $5$ s. Find the rise in m, the run in s, and the walker's velocity in m/s.
Find the rise.
$\Delta x = x_2 - x_1 =$ r
Change in position.
Find the run.
$\Delta t = t_2 - t_1 =$ s
Change in time.
Find the slope.
$v = \dfrac{\Delta x}{\Delta t} =$ v
Rise over run.
Interpret the slope.
$\text{steady walking away from the origin}$
Straight rising line.
Match each graph feature to what it tells you.
| the velocity | the acceleration | the displacement | moving at a steady velocity | |
|---|---|---|---|---|
| the slope of a position-time graph | ||||
| the slope of a velocity-time graph | ||||
| the area under a velocity-time graph | ||||
| a flat line on a velocity-time graph |
A straight line on a velocity-time graph runs from $0$ m/s at $0$ s to $12$ m/s at $4$ s. Fill in the acceleration in m/s², the displacement in m, and the average velocity in m/s.
| value | |
|---|---|
| acceleration (m/s²) | |
| displacement (m) | |
| average velocity (m/s) |
A go-kart starts from rest and speeds up steadily at $8$ m/s². Its velocity-time graph is a straight line from the origin. Using the area under that line, write the distance it has traveled, in m, as a function of the time $t$ in seconds.
Answer:
A train's velocity-time graph climbs in a straight line from $0$ to $10$ m/s over $4$ s, then stays flat at $10$ m/s for another $6$ s. How far does the train travel in that time, in m?
Answer: m
In the Marine Corps Marathon in Washington, D.C., a runner's timing chips record $8$ km at $40$ minutes and $38$ km at $170$ minutes. Treating her distance-time graph as straight between the splits, what is her speed, in km/h?
Answer: km/h
Lesson test: one question per skill, one attempt each, no hints. Your answers are checked when you submit.
A go-kart starts from rest and speeds up steadily at $4$ m/s². Its velocity-time graph is a straight line from the origin. Using the area under that line, write the distance it has traveled, in m, as a function of the time $t$ in seconds.
Answer:
You can read motion graphs. Explain to someone why a rising position-time line on a flat road does not mean the car climbed a hill.
26. Your turn: a position-time line passes through $5$ m at $1$ s and $35$ m at $6$ s. What velocity does it show?, step 3
$v = 6\ \text{m/s}$
Steady.